
Which Trading Day of the Month Pays Best? Turn-of-the-Month Analysis in Python
July 29, 2026
What's the question?
The turn-of-the-month effect is one of the oldest documented calendar anomalies. Lakonishok and Smidt reported in 1988 that four sessions, the last trading day of a month plus the first three of the next, accounted for more than the whole monthly return of the Dow Jones Industrial Average over 90 years. The explanation offered then was cash flow, not risk: salaries, pension contributions and fund distributions settle at month boundaries on schedule.
Published anomalies tend to shrink afterwards, so asking whether this one survives is the obvious test. It is also the wrong one. A four-day window averages over its own contents, and if the settlement story holds, returns should cluster on the session when cash actually lands. Two questions need separating: whether the window still beats the rest of the month, and which day inside it does the work.
The approach
The test covers seven ETFs: SPY (US large cap), MDY (US mid cap), IWM (US small cap), EFA (developed international), EEM (emerging markets), TLT (long Treasuries) and LQD (investment-grade credit). The bond funds act as a control, since payroll flows reach them as readily as equity funds, so an effect confined to equities points at something other than plain cash settlement.
- Pull daily closes, split-adjusted closes and dividends for each ETF. The sample ends at the last complete calendar year, 31 December 2024, so no partial year skews a calendar statistic. SPY and MDY start in 1996, the others at inception.
- Build a daily total return as (adjusted close + dividend) divided by the previous adjusted close, minus one, so distributions land on their ex-dates. TLT and LQD distribute monthly, and 91 percent of their ex-dividend dates fall on the first session of a month.
- Index every session by its position inside the calendar month: +1 is the first trading session, +2 the second, -1 the last. Partial months at the start of each series are dropped so no session is mislabelled.
- Compute the mean return at each position from -5 to +10 for SPY, then Welch t-test the classic -1 to +3 window against the rest of the month across three sub-periods.
- Repeat for all seven ETFs.
Code
import numpy as np
import pandas as pd
import xfinlink as xfl
from scipy import stats

xfl.set_api_key("YOUR_API_KEY")  # free at https://xfinlink.com/signup

TICKERS = ["SPY", "MDY", "IWM", "EFA", "EEM", "TLT", "LQD"]

def load(ticker):
    d = xfl.prices(ticker, start="1996-01-01", end="2024-12-31",
                   fields=["close", "adj_close", "dividend"]).sort_values("date")
    factor = d["adj_close"] / d["close"]
    d["ret"] = ((d["adj_close"] + d["dividend"].fillna(0.0) * factor)
                / d["adj_close"].shift(1) - 1)
    month = d["date"].dt.to_period("M")
    d["fwd"] = d.groupby(month).cumcount() + 1
    d["bwd"] = d.groupby(month).cumcount(ascending=False) + 1
    d["pos"] = np.where(d["bwd"] <= 5, -d["bwd"], d["fwd"])
    d["classic"] = (d["bwd"] == 1) | (d["fwd"] <= 3)
    first_full = (month.min() + 1).to_timestamp()
    return d[d["date"] >= first_full].dropna(subset=["ret"]).reset_index(drop=True)

panel = {t: load(t) for t in TICKERS}
spy = panel["SPY"]

prof = spy[spy["pos"].between(-5, 10)].groupby("pos")["ret"].agg(["mean", "std", "count"])
prof["t"] = prof["mean"] / (prof["std"] / np.sqrt(prof["count"]))
print(prof[["mean", "t"]])

for t in TICKERS:
    d = panel[t]
    a, b = d.loc[d["pos"] == 1, "ret"], d.loc[d["pos"] != 1, "ret"]
    tt = stats.ttest_ind(a, b, equal_var=False)
    print(t, round(a.mean() * 1e4, 2), round(b.mean() * 1e4, 2), round(tt.statistic, 2))
Full script with formatting and visualisation: turn-of-the-month-first-trading-day-python.py
Output
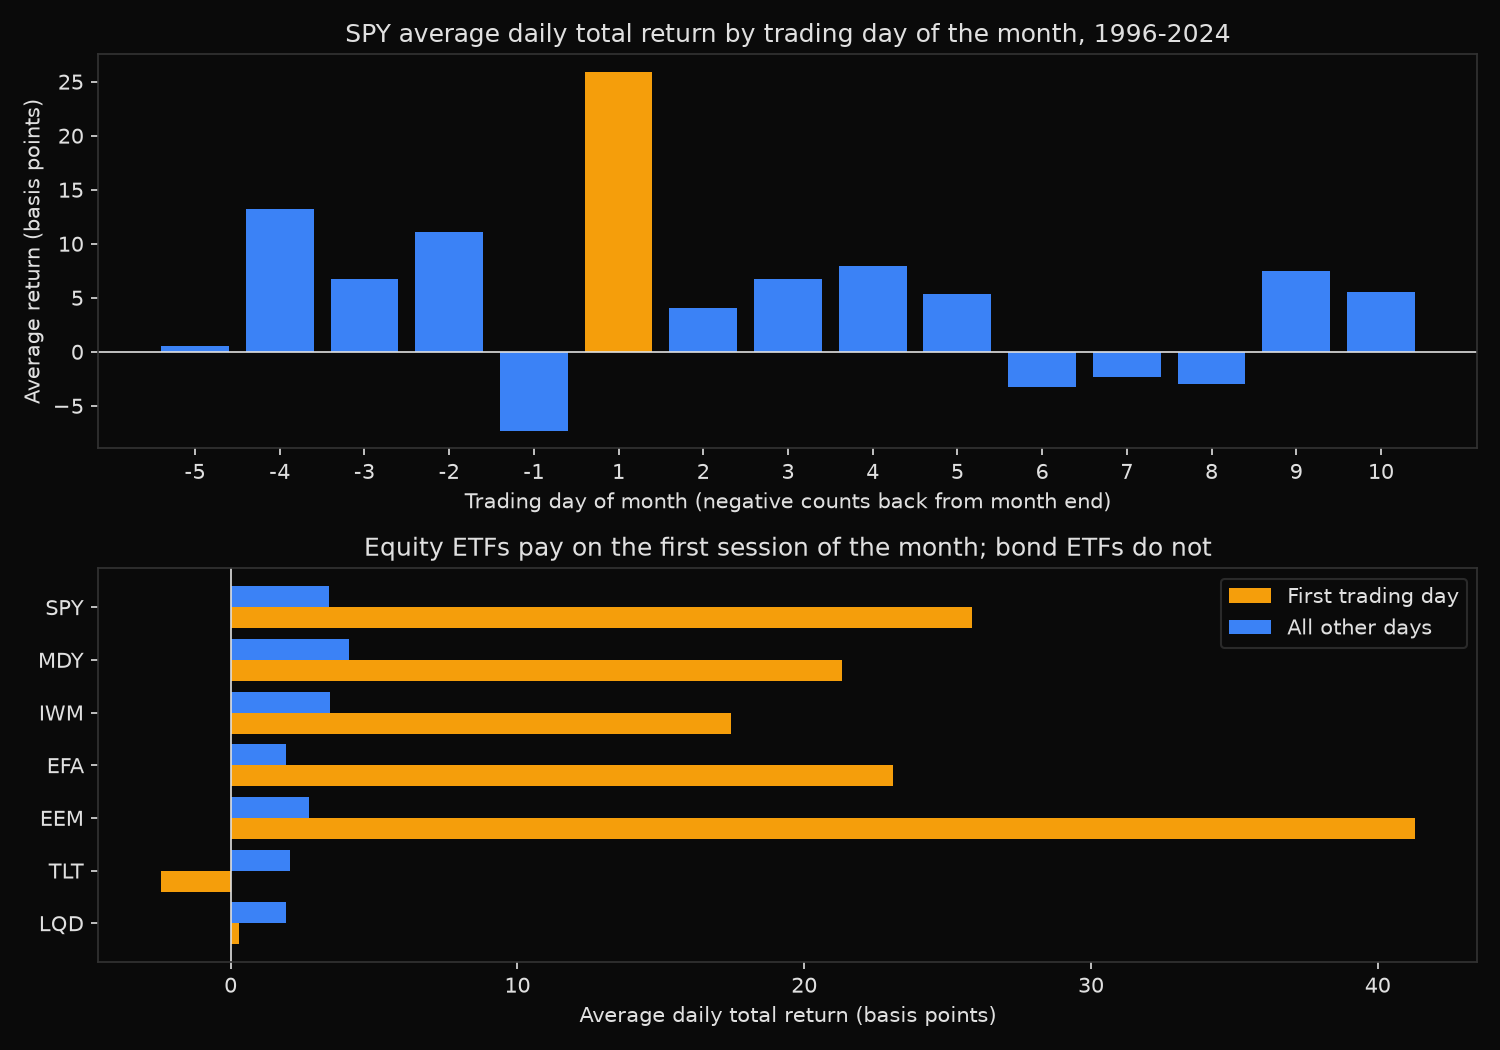
SPY mean total return by trading day of month, 1996-2024
  pos  months   bps   t-stat
   -5    347    0.51    0.08
   -4    347   13.26    1.86
   -3    347    6.77    1.13
   -2    347   11.04    1.67
   -1    347   -7.29   -1.24
   +1    347   25.86    3.65
   +2    347    4.07    0.64
   +3    347    6.70    1.10
   +4    347    7.98    1.16
   +5    347    5.33    0.89
   +6    347   -3.26   -0.50
   +7    347   -2.30   -0.36
   +8    347   -2.97   -0.48
   +9    347    7.52    0.92
  +10    347    5.53    0.90

SPY classic turn-of-month window (-1 to +3) vs rest of month
  1996-2005  window 12.06 bps   rest 2.11 bps   diff  9.95   t  1.57   p 0.117
  2006-2015  window  4.31 bps   rest 3.46 bps   diff  0.86   t  0.14   p 0.892
  2016-2024  window  5.49 bps   rest 6.10 bps   diff -0.61   t -0.10   p 0.917

First trading day of month vs all other days
  ticker  from        months   day+1     other      diff   t-stat   p      hit
  SPY     1996-02-01    347    25.86     3.42     22.44    3.11  0.0020  0.640
  MDY     1996-02-01    347    21.31     4.14     17.17    2.02  0.0439  0.611
  IWM     2000-06-01    295    17.44     3.48     13.96    1.36  0.1749  0.614
  EFA     2001-09-04    280    23.11     1.94     21.17    2.45  0.0150  0.621
  EEM     2003-05-01    260    41.29     2.74     38.55    3.51  0.0005  0.638
  TLT     2002-08-01    269    -2.42     2.07     -4.50   -0.68  0.4999  0.483
  LQD     2002-08-01    269     0.28     1.94     -1.66   -0.53  0.5994  0.498

SPY 1996-2024: $1 held only on the first trading day of each month -> $2.377 across 347 sessions (4.8% of trading days); buy and hold -> $15.31 (9.90% a year)
SPY first-day median 28.92 bps, 5% trimmed mean 29.82 bps, ex-January mean 24.84 bps
What this tells us
The classic four-day window is finished. Its edge over the rest of the month was 9.95 basis points a day in 1996-2005, not significant even then at p = 0.117; the gap fell to 0.86 basis points across 2006-2015 and turned slightly negative, at -0.61, across 2016-2024.
The day-level profile explains why. One session carries almost everything: position +1 averaged 25.86 basis points against 3.42 on all other days, t = 3.65 against zero and p = 0.0003, which survives a Bonferroni correction for the 15 positions tested. The window is diluted by its own members. Position -1 averaged -7.29 basis points, and positions +2 and +3 sat near the all-day average.
Outliers do not drive it: the median of 28.92 basis points exceeds the mean, the 5 percent trimmed mean is 29.82, dropping January leaves 24.84, and the direction was right in 64.0 percent of 347 months.
Asset class separates them. Every equity fund shows a positive first-day premium, from 13.96 basis points for IWM to 38.55 for EEM, significant for SPY, MDY, EFA and EEM. Both bond funds show nothing: LQD averaged 0.28 basis points on the first session and TLT -2.42, hit rates of 49.8 and 48.3 percent are coin flips, and neither difference approaches significance at p = 0.60 and p = 0.50. That is absence, not reversal, and it still weakens the retirement-contribution story: those contributions buy bond funds too.
So what?
Compounding SPY total returns on first sessions alone turns $1 into $2.377 across 29 years, against $15.31 for buy and hold. Cash for the other 95.2 percent of sessions gives up almost everything, so this is no standalone strategy. It is worth 31.7 percent of the compounded log return of the market from 4.8 percent of its sessions.
That makes the first trading day a calendar constraint rather than a trade. Rebalancing programmes and systematic de-risking should avoid selling equity into that session, preferring position -1 or mid-month, where the average return is flat to negative. Measure any monthly rebalance against this profile before assuming its date is neutral.
The caution is size. A 22 basis point edge once a month is roughly 2.7 percent a year gross, and round-trip costs eat a real share of that. The signal is genuine but small enough that execution quality decides what survives.
pip install -U xfinlink