Can Quality Screens Reduce Small-Cap Balance-Sheet Risk? Russell 2000 Test in Python
June 12, 2026
What's the question?
Small-cap investing often mixes two different exposures: size and financial fragility. A small company can be cheap because it is overlooked, or because it has weak profitability, thin cash generation, and too much debt. A quality screen attempts to separate those cases.
The question is whether a simple quality score can identify materially stronger balance-sheet profiles inside a point-in-time Russell 2000 sample. The goal is not to forecast returns. The goal is to reduce avoidable balance-sheet risk before doing deeper security analysis.
The approach
The analysis uses 300 Russell 2000 constituents as of December 31, 2025. Built from SEC EDGAR public filings and market data, it then pulls the latest annual metrics for those companies.
- Pull point-in-time Russell 2000 constituents with
as_of="2025-12-31" - Pull ROE, free-cash-flow margin, debt/assets, interest coverage, and market cap
- Remove records with missing data and extreme pre-revenue or distressed accounting values
- Winsorize the scoring inputs at the 5th and 95th percentiles
- Reward higher ROE, higher free-cash-flow margin, lower leverage, and higher interest coverage
The outlier controls are part of the method. Without them, a few extreme small-cap observations dominate the score.
Code
import xfinlink as xfl
import pandas as pd

xfl.set_api_key("YOUR_API_KEY")  # free at https://xfinlink.com/signup

members = xfl.index("russell2000", as_of="2025-12-31", limit=300)
tickers = members["ticker"].dropna().tolist()
fields = ["roe", "fcf_margin", "debt_to_assets", "interest_coverage", "market_cap"]

df = xfl.metrics(tickers, period_type="annual", period="3y", fields=fields)
latest = df.sort_values("period_end").groupby("ticker").tail(1).set_index("ticker")
screen = latest[fields].dropna()

screen = screen[
    screen["roe"].between(-1, 1)
    & screen["fcf_margin"].between(-1, 1)
    & screen["debt_to_assets"].between(0, 1.5)
]

print(screen[["roe", "fcf_margin", "debt_to_assets"]].describe())
Full script with formatting and visualisation: russell2000-quality-balance-sheet-python.py
Output
=== Russell 2000 Quality Balance-Sheet Screen ===
Membership date: 2025-12-31
Constituents requested: 300
Complete annual metric records: 176
Records after outlier controls: 129
Top quality quintile median ROE:   12.7%
Bottom quality quintile median ROE:  -14.1%
Top quality quintile median debt/assets:    5.0%
Bottom quality quintile median debt/assets:   40.1%

Top quality names:
TBBK   score=  7.17  ROE=  33.1%  FCF_margin=  36.6%  debt/assets=   2.3%  interest_cover=  298.1  market_cap=$2,393M
AII    score=  7.10  ROE=  29.6%  FCF_margin=  48.2%  debt/assets=   0.0%  interest_cover= 3385.0  market_cap=$330M
BANF   score=  5.94  ROE=  13.0%  FCF_margin=  34.3%  debt/assets=   0.1%  interest_cover=   75.0  market_cap=$3,828M
SRCE   score=  5.65  ROE=  12.4%  FCF_margin=  49.1%  debt/assets=   2.6%  interest_cover=   46.6  market_cap=$1,894M
APAM   score=  5.31  ROE=  66.2%  FCF_margin=  14.3%  debt/assets=  12.0%  interest_cover=   51.2  market_cap=$2,863M
AMTB   score=  5.13  ROE=   5.6%  FCF_margin=  29.4%  debt/assets=   0.0%  interest_cover= 5512.8  market_cap=$966M
AGYS   score=  5.01  ROE=  11.9%  FCF_margin=  21.3%  debt/assets=   0.0%  interest_cover=   87.3  market_cap=$2,585M
BWFG   score=  4.99  ROE=  11.7%  FCF_margin=  25.0%  debt/assets=   5.4%  interest_cover=  198.1  market_cap=$436M

Lowest quality names:
BKSY   score= -6.25  ROE= -74.1%  FCF_margin= -41.8%  debt/assets=  52.1%  interest_cover=   -3.1  market_cap=$1,292M
BHR    score= -4.80  ROE= -16.1%  FCF_margin=  -5.3%  debt/assets= 119.1%  interest_cover=    0.7  market_cap=$173M
BBAI   score= -4.72  ROE= -48.0%  FCF_margin= -33.3%  debt/assets=  12.0%  interest_cover=  -11.8  market_cap=$1,809M
ARDX   score= -4.70  ROE= -36.9%  FCF_margin= -10.8%  debt/assets=  40.4%  interest_cover=   -2.0  market_cap=$1,415M
TKNO   score= -4.42  ROE= -25.1%  FCF_margin= -24.2%  debt/assets=  12.9%  interest_cover=  -77.2  market_cap=$236M
ADPT   score= -4.40  ROE= -27.2%  FCF_margin= -17.7%  debt/assets=  24.7%  interest_cover=   -4.8  market_cap=$2,880M
BALY   score= -4.37  ROE= -65.4%  FCF_margin=  -7.3%  debt/assets=  39.7%  interest_cover=   -0.7  market_cap=$719M
BORR   score= -3.93  ROE=   8.3%  FCF_margin= -32.9%  debt/assets=  61.8%  interest_cover=    1.8  market_cap=$1,141M
What this tells us
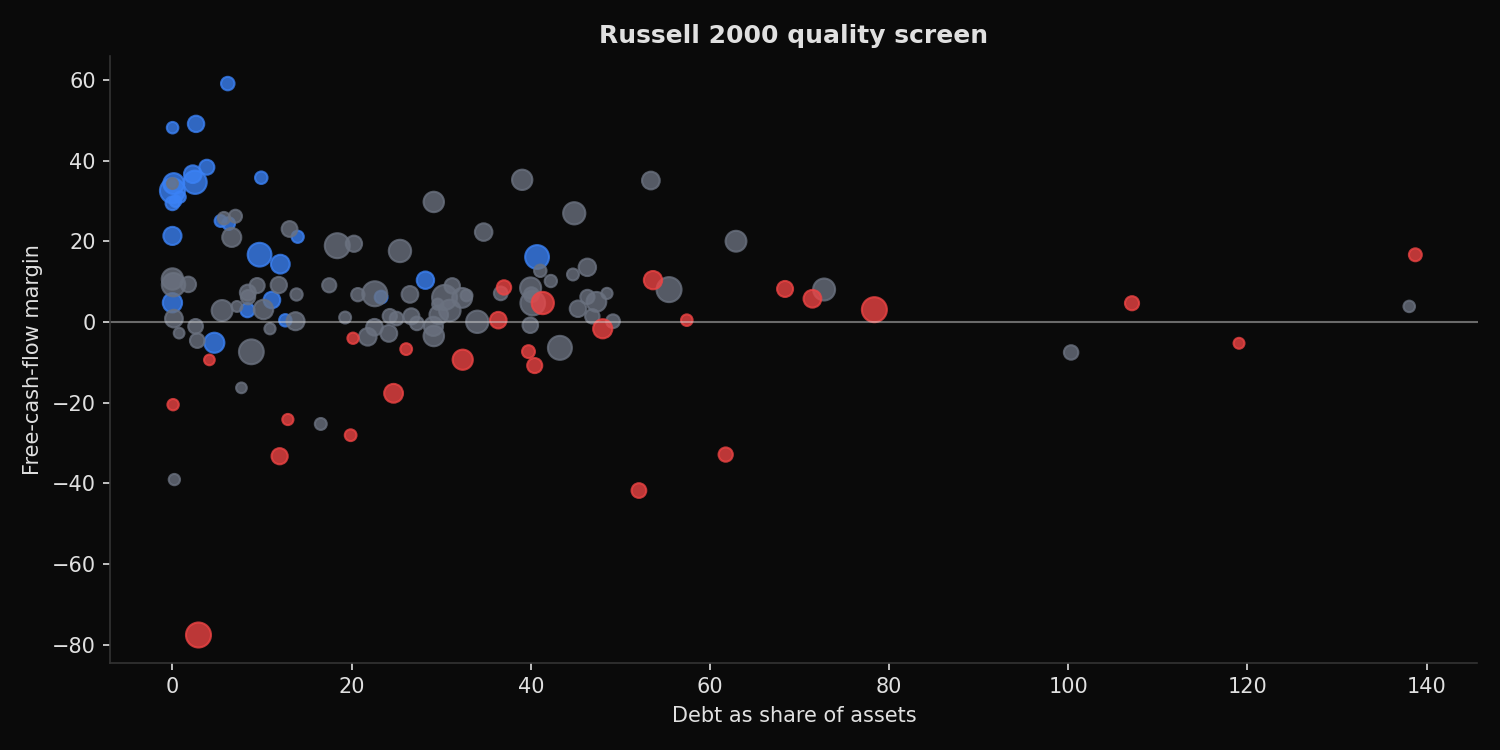
The screen separates the balance-sheet profile clearly. The top quality quintile has median ROE of 12.7% and median debt/assets of 5.0%. The bottom quality quintile has median ROE of -14.1% and median debt/assets of 40.1%.
That difference is economically meaningful. The top group is not merely less leveraged. It is also more profitable and more cash generative. The bottom group contains companies with negative free-cash-flow margins, weak interest coverage, and high balance-sheet pressure.
The outlier controls matter. Small-cap universes include early-stage companies, distressed companies, and accounting edge cases. A quality process should identify those cases explicitly rather than letting them dominate the score.
So what?
A Russell 2000 allocation can carry more balance-sheet risk than the index label suggests. Screening for quality before valuation helps avoid companies where cheapness may reflect financial fragility.
The practical use is as a triage step. Start with point-in-time membership, remove incomplete and distorted records, then rank profitability, free cash flow, leverage, and interest coverage. The result is a cleaner research queue for small-cap portfolios.
Built with xfinlink — free financial data API for Python. pip install -U xfinlink
pip install -U xfinlink