
Does a 60/40 Portfolio Actually Cut Drawdowns? Stocks and Bonds in Python
August 16, 2026
What’s the question?
The 60/40 portfolio, sixty percent stocks and forty percent bonds, is the default recommendation for an investor who wants equity-like growth with less pain. The promise rests on one idea: bonds hold their value, or gain, when stocks fall, so the mix suffers shallower losses than stocks alone. A shallower loss is easier to hold through, and an investor who does not sell at the bottom keeps the long-run return.
Drawdown is the measure that matters for this promise. A drawdown is the drop from a portfolio’s previous high to a later low, the peak-to-trough loss an investor actually lives through. Volatility describes the daily jitter; drawdown describes the deep, sustained declines that cause people to abandon a plan. The question is whether adding bonds meaningfully reduces the depth of those declines, and what an investor gives up in return.
The approach
The test runs from January 2008 to December 2025, a window chosen to include three very different stress events: the 2008 financial crisis, the 2020 pandemic crash, and the 2022 selloff in which stocks and bonds fell at the same time. SPY represents equities and AGG represents the US investment-grade bond market. Both use total return, so dividends and bond coupons are reinvested and the comparison is fair to bonds, whose return is mostly income.
- Pull daily total returns for SPY and AGG over the full window.
- Build a 60/40 portfolio that resets to sixty percent stocks and forty percent bonds at the end of every month, letting the weights drift between rebalances the way a real portfolio does.
- For both the 60/40 and a 100 percent equity portfolio, compute the compound annual growth rate, the annualised volatility, the worst drawdown, and the worst rolling twelve-month total return.
- Examine 2020 and 2022 on their own, because they show the mix working as intended and then failing to.
Monthly rebalancing is the realistic middle ground. Daily rebalancing is unachievable after costs, and never rebalancing lets the equity weight creep upward until the portfolio is no longer a 60/40.
Code
import numpy as np
import pandas as pd
import xfinlink as xfl

xfl.set_api_key("YOUR_API_KEY")  # free at https://xfinlink.com/signup

px = xfl.prices(["SPY", "AGG"], start="2008-01-01", end="2025-12-31",
                fields=["return_daily"], max_rows=200000)
r = px.pivot_table(index="date", columns="ticker", values="return_daily").dropna()

# 60/40 reset to fixed weights each month-end, drifting within the month
w = pd.Series({"SPY": 0.60, "AGG": 0.40})
port = pd.Series(index=r.index, dtype=float)
for _, block in r.groupby(r.index.to_period("M")):
    val = ((1 + block).cumprod() * w).sum(axis=1)
    port.loc[block.index] = (val / val.shift(1).fillna(1.0)).values - 1
port = port.dropna()

def max_drawdown(returns):
    cum = (1 + returns).cumprod()
    return (cum / cum.cummax() - 1).min()

print("equity", round(max_drawdown(r["SPY"].loc[port.index]) * 100, 1))
print("60/40 ", round(max_drawdown(port) * 100, 1))
Full script with formatting and visualisation: does-a-60-40-portfolio-cut-drawdowns-python.py
Output
SPY (100% equity) vs a monthly-rebalanced 60/40 SPY/AGG, total return
daily data 2008-01-02 to 2025-12-31, 4529 trading days

100% equity     CAGR 10.92%   vol 19.95%   max drawdown  -51.9%   worst 12m  -47.4%   return/vol 0.55
60/40           CAGR  7.85%   vol 11.99%   max drawdown  -34.2%   worst 12m  -30.4%   return/vol 0.65

2020 total return  equity   18.4%   bonds    7.5%   60/40   14.7%
2022 total return  equity  -18.2%   bonds  -13.0%   60/40  -15.8%
What this tells us
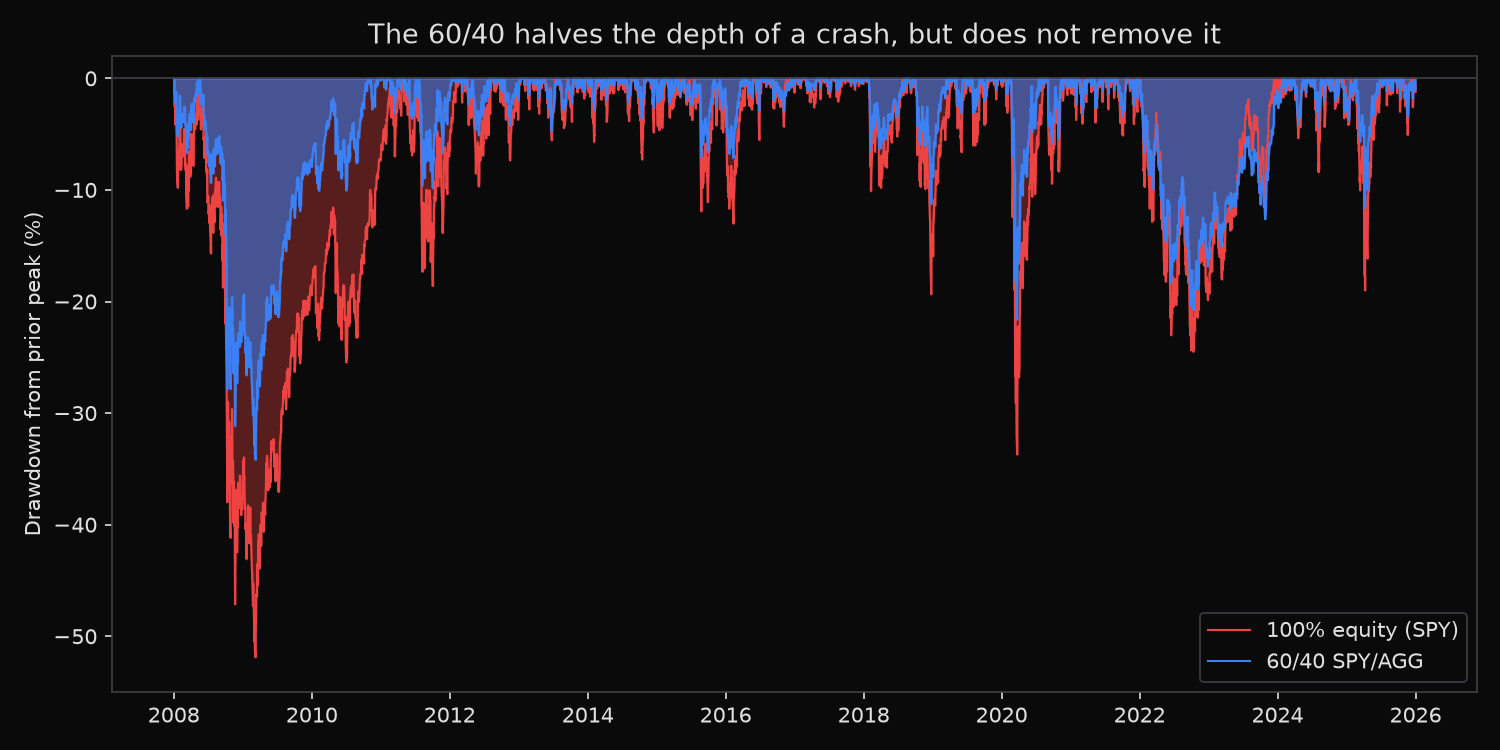
The mix does what it claims, with one large exception. Across the full window the worst drawdown fell from 51.9 percent for all-equity to 34.2 percent for the 60/40, a reduction of roughly a third. The worst twelve-month stretch improved from a 47.4 percent loss to a 30.4 percent loss. Annualised volatility dropped from 19.9 percent to 12.0 percent. The return-to-volatility ratio rose from 0.55 to 0.65, so the smoother ride was not merely the result of holding less of everything; each unit of risk bought slightly more return.
The cost is growth. The 60/40 compounded at 7.85 percent a year against 10.92 percent for all-equity. Over eighteen years that gap is large in absolute terms, the price paid for the shallower drawdowns. Whether the trade is worth it depends on whether an investor would have held the all-equity portfolio through a 52 percent loss without selling. Many would not, and a plan abandoned at the bottom returns less than a smoother plan held to the end.
The exception is 2022, and it is the reason the chart’s title matters. In 2020 the mix worked cleanly: equities returned 18.4 percent, bonds added 7.5 percent, and the 60/40 captured most of the upside. In 2022 both fell together. Equities lost 18.2 percent, and bonds, hit by the sharpest rate rise in decades, lost 13.0 percent. The 60/40 lost 15.8 percent, barely better than a coin flip between the two. Bonds cushion equity drawdowns when the shock is a growth scare or a panic. They do not cushion when the shock is rising interest rates, because that shock hits both assets at once.
So what?
For most investors the 60/40 remains a sound default, and the numbers explain why: a third off the worst drawdown, a smoother path, and a better return per unit of risk, in exchange for lower long-run growth. The right stock-bond split follows from a single honest question, namely the largest loss that can be held through without selling. An investor who would panic at a 50 percent drawdown but not a 34 percent one is better off in the 60/40 even after the lower return, because the version they will actually stick with is the one that compounds.
The 2022 result is the part to plan around. Bonds are a hedge against equity risk, not against all risk, and their protection weakens exactly when inflation and rates are the problem. An allocation that needs to withstand that specific scenario cannot rely on bonds alone; it calls for assets with different sensitivities, such as inflation-linked bonds, commodities, or a cash buffer. The 60/40 shrinks the average crash. It does not make the portfolio crash-proof, and the years when bonds fail to help are precisely the years worth preparing for.
Built with xfinlink — free financial data API for Python. pip install -U xfinlink
pip install -U xfinlink