
How Much S&P 500 Profit Skips the Income Statement? Other Comprehensive Income in Python
September 14, 2026
What’s the question?
Net income is not the whole of a company’s profit. US accounting routes a particular set of gains and losses around the income statement and straight into equity: currency translation on overseas subsidiaries, marks on available-for-sale debt securities, cash flow hedge adjustments, and remeasurements of defined benefit pension obligations. Those four items are other comprehensive income, or OCI. Net income plus OCI gives comprehensive income, the figure that reconciles to the change in book equity.
Earnings per share ignores OCI completely, and so does every ratio built on it. Book value does not. Return on equity therefore carries OCI in its denominator while excluding it from its numerator, which is fine when the amounts are trivial and misleading when they are not.
So the question is one of size. If OCI is small and its sign flips at random, ignoring it costs nothing. If it is large, persistent in one direction, or concentrated in particular businesses, then profit and equity for the same company measure two different things, and any screen mixing them inherits the gap.
The approach
- Take the S&P 500 roster as it stood on 31 December 2024 and carry every member by its permanent entity id, so a symbol reassigned to another company cannot substitute one business for another.
- Pull annual statements with a period end between 1 June 2017 and 30 June 2025, keeping net income, comprehensive income, book equity, and accumulated other comprehensive income.
- Compute each fiscal year’s OCI as comprehensive income minus net income.
- Apply the identity that links the two statements: a year’s OCI must also appear as the movement in accumulated other comprehensive income on the balance sheet. A company-year enters the sample only where the two routes to that quantity agree to within 1% of book equity.
- Keep companies with one annual report ending in each of the six calendar years 2019 through 2024, so the yearly totals describe a fixed set of businesses.
That leaves 354 companies and 2,124 company-years. As a check, JPMorgan’s comprehensive income for all six years and Lockheed Martin’s for 2022 were compared against those companies’ own XBRL submissions to the SEC: all seven matched to the dollar.
Code
import pandas as pd
import xfinlink as xfl

xfl.set_api_key("YOUR_API_KEY")  # free at https://xfinlink.com/signup

roster = xfl.index("sp500", as_of="2024-12-31")
entity_ids = sorted({int(e) for e in roster["entity_id"].dropna()})

frames = []
for i in range(0, len(entity_ids), 50):
    frames.append(xfl.fundamentals(
        entity_id=entity_ids[i:i + 50], period_type="annual",
        start="2017-06-01", end="2025-06-30",
        fields=["comprehensive_income", "net_income", "total_equity",
                "accumulated_other_comprehensive_income"]))
raw = pd.concat(frames, ignore_index=True)

df = raw.sort_values(["entity_id", "period_end"]).copy()
df["oci"] = df["comprehensive_income"] - df["net_income"]
df["d_aoci"] = df.groupby("entity_id")["accumulated_other_comprehensive_income"].diff()
df["year"] = df["period_end"].dt.year

w = df[(df["period_end"] >= "2019-01-01") & (df["period_end"] <= "2024-12-31")].copy()
w = w[(w["oci"] - w["d_aoci"]).abs() <= 0.01 * w["total_equity"].abs()]
w = w.sort_values("period_end").drop_duplicates(["entity_id", "year"], keep="last")
p = w[w.groupby("entity_id")["year"].transform("nunique") == 6]

yr = p.groupby("year").agg(ni=("net_income", "sum"), oci=("oci", "sum"))
print(100 * yr["oci"] / yr["ni"])

co = p.groupby(["entity_id", "gics_sector"]).agg(ni=("net_income", "sum"),
                                                 oci=("oci", "sum")).reset_index()
sec = co.groupby("gics_sector").agg(ni=("ni", "sum"), oci=("oci", "sum"))
print(100 * sec["oci"] / sec["ni"])
Full script with formatting and visualisation: other-comprehensive-income-sp500-python.py
Output
S&P 500 members at 2024-12-31: 500   annual rows retrieved: 3,993
Company-years passing the reconciliation: 2,672
Balanced panel: 354 companies x 6 years = 2,124 company-years

Year   Net income $bn   OCI $bn   OCI as % of net income   Companies with OCI < 0
2019            979.6      17.5                    1.8                    56%
2020            679.8      38.3                    5.6                    44%
2021          1,431.9       2.1                    0.1                    47%
2022          1,232.5    -221.1                  -17.9                    67%
2023          1,436.0      50.7                    3.5                    34%
2024          1,531.1      -8.4                   -0.5                    62%

Six-year totals: net income $7,291bn, OCI $-121bn (-1.66% of net income)
Companies with negative six-year OCI: 231 of 354 (65%)
Of the 338 with positive six-year net income, median OCI is -0.63% of it; 11.2% sit beyond plus or minus 10%

Sector                    N   Net income $bn   OCI $bn   OCI as % of net income
Financials               55          1,867    -101.9                  -5.46
Materials                18            156      -7.8                  -4.97
Communication Services   12            878     -14.5                  -1.65
Consumer Staples         24            400      -5.3                  -1.32
Consumer Discretionary   38            618      -7.5                  -1.21
Real Estate              24            108      -0.9                  -0.85
Information Technology   50          1,445      -9.3                  -0.65
Health Care              44            730      -0.1                  -0.01
Energy                   18            448       5.9                   1.31
Industrials              50            478      14.7                   3.08
Utilities                21            162       5.9                   3.60

2022, the six largest OCI losses and the six largest OCI gains ($m)
  loss SCHWAB CHARLES CORP               Financials              net income     7,183   OCI   -21,512
  loss JPMORGAN CHASE & CO               Financials              net income    37,676   OCI   -17,257
  loss BANK OF AMERICA CORP              Financials              net income    27,528   OCI   -16,052
  loss TRUIST FINANCIAL CORP             Financials              net income     6,267   OCI   -11,997
  loss WELLS FARGO & CO                  Financials              net income    13,677   OCI   -11,616
  loss Apple Inc                         Information Technology  net income    99,803   OCI   -11,272
  gain BERKSHIRE HATHAWAY INC            Financials              net income   -22,759   OCI     3,071
  gain LOCKHEED MARTIN CORP              Industrials             net income     5,732   OCI     2,983
  gain BOEING CO                         Industrials             net income    -4,935   OCI     2,109
  gain UNITED PARCEL SERVICE INC         Industrials             net income    11,548   OCI     1,729
  gain PROCTER & GAMBLE CO               Consumer Staples        net income    14,742   OCI     1,555
  gain General Motors Company            Consumer Discretionary  net income     9,934   OCI     1,369
What this tells us
Across the six years the panel earned $7,291bn of net income and lost $121bn through OCI, or 1.66% of profit, a figure small enough to forget. The distribution is what makes it interesting.
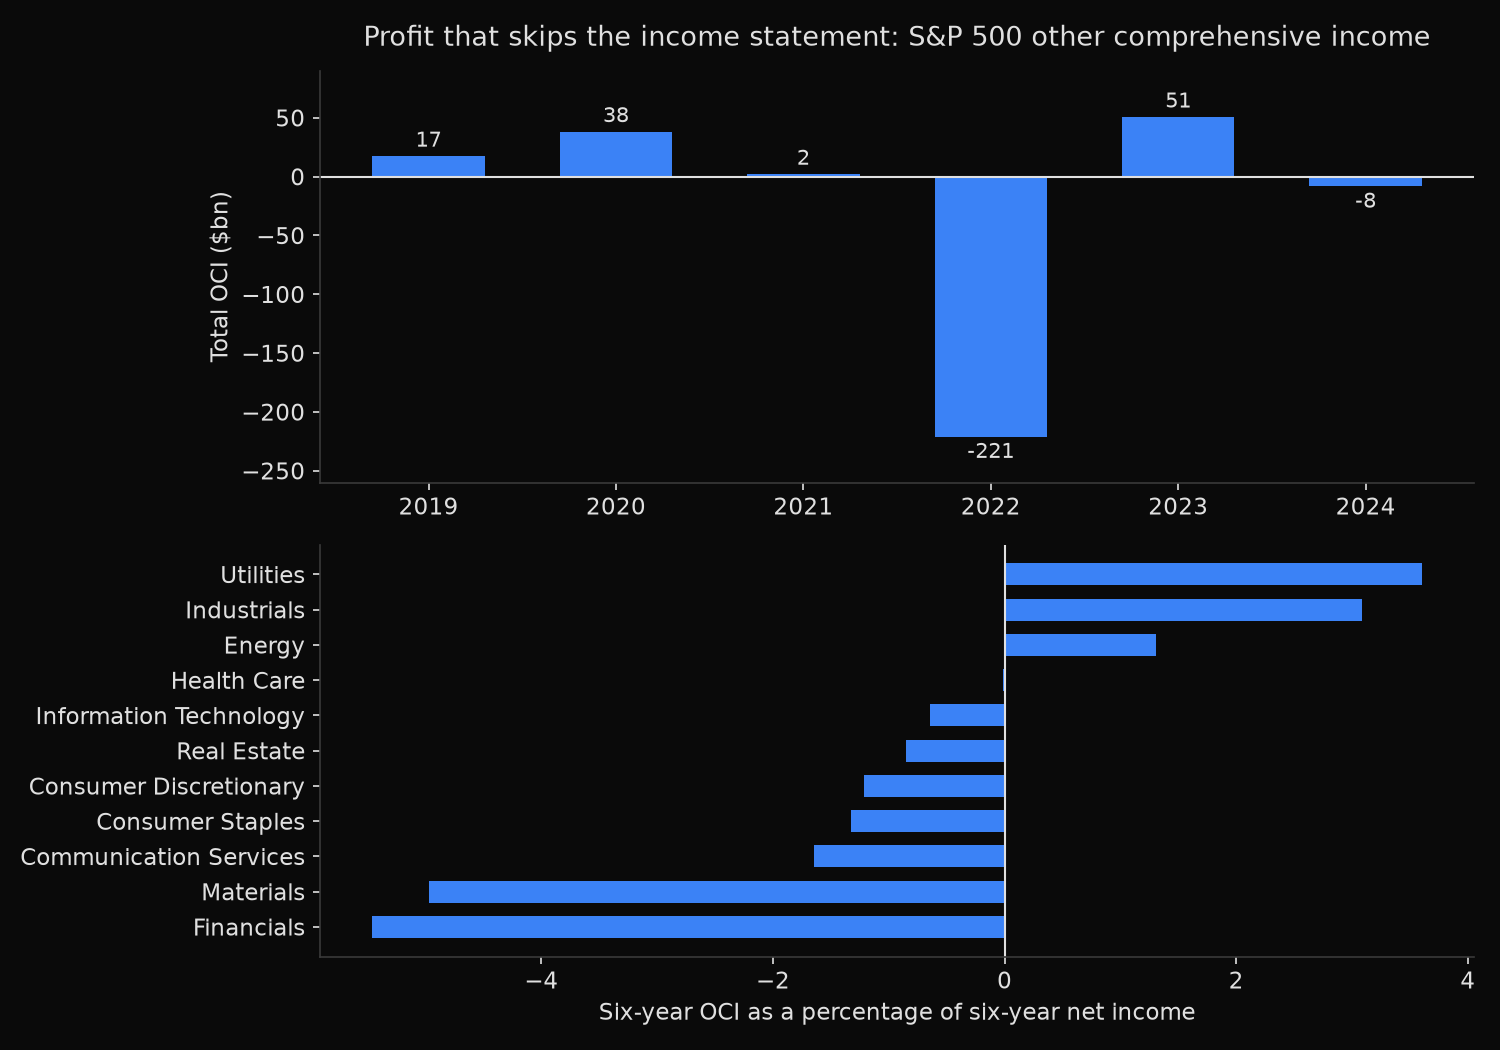
2022 is the year that matters. OCI reached minus $221.1bn, equal to 17.9% of the net income the same companies reported, and two thirds of the panel recorded a loss. The six largest single losses add to $89.7bn on their own, roughly 40% of the year’s total, and five of the six are banks. The mechanism is the rate rise: a bank marks its available-for-sale bond portfolio to market every quarter, and the mark goes to OCI rather than to earnings. Charles Schwab reported $7,183m of net income in 2022 and a $21,512m OCI loss, three times the profit it announced.
The same rate move ran the other way for a different kind of company. Five of the six largest gains belong to businesses with large defined benefit pension plans, whose obligations are discounted at market rates and shrink when those rates rise. Boeing is the clearest case: it lost $4,935m at the net income line in 2022 and still booked a $2,109m gain through OCI.
The sector totals carry the same split: Financials at minus 5.46% of six-year net income, their $101.9bn of losses accounting for most of the $121bn the panel gave up, against Utilities at plus 3.60% and Industrials at plus 3.08%. Health Care nets to minus 0.01%.
For the median company OCI is minus 0.63% of six-year profit, so the typical S&P 500 member can ignore it. The tails cannot: 11.2% sit beyond plus or minus 10%, and 65% are negative over the window, a persistent drag rather than noise cancelling out. The 2023 rebound of $50.7bn recovered less than a quarter of what 2022 removed.
So what?
Add one line to any screen built on reported earnings: comprehensive income minus net income, as a share of net income. Roughly one company in nine breaches 10% of profit, and those are the names where an earnings ratio and a book ratio have stopped describing the same business.
The consequence is sharpest for return on equity. When a bank marks its bond book down, the loss lands in book equity immediately and never passes through the numerator, so reported ROE rises at the moment shareholder capital falls. Anyone ranking financials on ROE through 2022 and 2023 was rewarding that mechanic, and using comprehensive income as the numerator removes it.
One caution for banks: treat OCI as a floor on the rate sensitivity of book value, not a full measure. Securities classified as held to maturity carry no mark through OCI, so a bank showing little OCI movement may simply have placed its rate exposure where the accounting does not report it.
Built with xfinlink — free financial data API for Python. pip install -U xfinlink
pip install -U xfinlink