
Which S&P 500 Companies Are Closest to Default? Merton Distance-to-Default in Python
August 6, 2026
What’s the question?
A lender owns a claim that pays in full unless the company fails; a shareholder owns whatever is left afterwards. Merton (1974) turned that ordering into an option: equity is a call on the firm’s assets, struck at the face value of the debt. Cover the debt and shareholders keep the remainder; fall short and they hand the firm to its lenders.
The output is distance to default, the number of standard deviations of asset value separating a firm from its default point. It combines two things usually looked at separately: the debt on the balance sheet, and how violently the assets move in value. The question is whether the combination reorders the S&P 500 against a plain leverage screen, or reproduces it with extra arithmetic.
The approach
Asset value and asset volatility are not observable. Both are solved from the market value of equity, its volatility, and the reported debt.
- Take current S&P 500 members outside financials and real estate, where the assumption of a simple debt structure holds up. Companies without reported long-term debt leave the sample.
- Set the default point to debt due within one year plus half of longer-dated debt, the Moody’s KMV convention; long-dated debt need not be repaid at the horizon, so counting all of it overstates the barrier. Filers differ over what that line holds, so the noncurrent figure from the filing is used where a company reports it inclusive of the current portion, and a company reporting no noncurrent long-term debt for the quarter leaves the sample.
- Build a one-year daily path of equity value from the latest market capitalisation and the split-adjusted close, then solve E = V·N(d1) − F·e^(−rT)·N(d2) for asset value V at each date given a trial asset volatility, recompute asset volatility from the solved values, and repeat until the two agree. Convergence took at most eight passes.
- Read off distance to default at the last date, using the one-year Treasury yield of 3.77% on 5 August 2026 as the drift.
- Screen the panel first: at least 200 trading sessions, no session-to-session move beyond 45% in log terms, which marks a spin-off rather than a return, and a market capitalisation within 15% of shares times price.
Every company named below was checked against its own filings on the SEC’s XBRL interface.
Code
import numpy as np, pandas as pd, xfinlink as xfl
from scipy.stats import norm

xfl.set_api_key("YOUR_API_KEY")  # free at https://xfinlink.com/signup

R, T = 0.0377, 1.0

def asset_value(E, F, sigma_V, r=R, t=T):
    """Invert E = V N(d1) - F exp(-rt) N(d2) for V, one V per equity observation."""
    V = E + F
    for _ in range(100):
        sq = sigma_V * np.sqrt(t)
        d1 = (np.log(V / F) + (r + 0.5 * sigma_V ** 2) * t) / sq
        gap = V * norm.cdf(d1) - F * np.exp(-r * t) * norm.cdf(d1 - sq) - E
        step = gap / np.maximum(norm.cdf(d1), 1e-8)
        V = np.maximum(V - step, E * 1.000001)
        if np.max(np.abs(step) / V) < 1e-12:
            break
    return V

def merton(E, F, r=R, t=T):
    sigma_E = np.diff(np.log(E)).std(ddof=1) * np.sqrt(252)
    sigma_V = sigma_E * E[-1] / (E[-1] + F)          # KMV starting guess
    for _ in range(300):
        V = asset_value(E, F, sigma_V, r, t)
        new = np.diff(np.log(V)).std(ddof=1) * np.sqrt(252)
        if abs(new - sigma_V) < 1e-10:
            sigma_V = new
            break
        sigma_V = new
    V = asset_value(E, F, sigma_V, r, t)
    dd = (np.log(V[-1] / F) + (r - 0.5 * sigma_V ** 2) * t) / (sigma_V * np.sqrt(t))
    return V[-1], sigma_V, dd, norm.cdf(-dd)

members = xfl.index("sp500")["ticker"].dropna().tolist()
fun = xfl.fundamentals(members, period_type="quarterly", start="2025-09-01",
                       fields=["current_portion_long_term_debt", "long_term_debt"])
latest = fun.sort_values("period_end").groupby("ticker").tail(1).set_index("ticker")
latest["F"] = latest["current_portion_long_term_debt"].fillna(0) + 0.5 * latest["long_term_debt"]

mcap = xfl.metrics(list(latest.index), period_type="daily", fields=["market_cap"],
                   start="2026-07-27")
px = xfl.prices(list(latest.index), period="1y", fields=["adj_close"])

for tk, s in latest.iterrows():
    path = px[px["ticker"] == tk].sort_values("date")["adj_close"].values
    E0 = mcap[mcap["ticker"] == tk].sort_values("period_end")["market_cap"].iloc[-1]
    V, sigma_V, dd, pdef = merton(E0 * path / path[-1], s["F"])
    print(f"{tk:6} asset vol {sigma_V:5.2f}  leverage {s['F'] / V:5.2f}  DD {dd:6.2f}")
Full script with formatting and visualisation: merton-distance-to-default-sp500-python.py
Output
============================================================================================================
MERTON DISTANCE TO DEFAULT | S&P 500 excluding financials and real estate | as at 2026-08-05
============================================================================================================
Equity as a one-year call on assets, strike = default point, risk-free rate 3.77% (1-year Treasury, 5 Aug 2026)
Default point = debt due within one year + half of longer-dated debt (KMV convention)
Asset value and asset volatility solved jointly from 1 year of daily equity values

S&P 500 members outside financials and real estate with reported debt    358
  with market capitalisation, share count and closing price             345
  with at least 200 trading sessions in the window                      343
  with no session-to-session move beyond 45% in log terms               340
  market capitalisation within 15% of shares x price                    340
Filing quarters used: 2025-12-31 to 2026-07-04

TWELVE SHORTEST DISTANCES TO DEFAULT
      company                              equity   default  equity  asset    F/V     DD  implied  leverage
                                               $m  point $m     vol    vol                default      rank
------------------------------------------------------------------------------------------------------------
CHTR  CHARTER COMMUNICATIONS INC           18,399    47,479    0.50   0.17   0.74   1.88    3.00%         1
SMCI  SUPER MICRO COMPUTER INC             18,234     2,330    0.92   0.82   0.11   2.28    1.13%       125
NCLH  NORWEGIAN CRUISE LINE HLDGS LTD       9,321     8,088    0.54   0.30   0.47   2.48    0.65%         4
KMX   CARMAX INC                            8,042     8,798    0.58   0.25   0.53   2.58    0.49%         2
LITE  LUMENTUM HOLDINGS INC                59,243     3,260    0.93   0.84   0.05   3.12    0.09%       226
NRG   N R G ENERGY INC                     25,390    12,384    0.48   0.35   0.33   3.12    0.09%        13
CZR   CAESARS ENTERTAINMENT INC DE          6,131     5,958    0.49   0.22   0.50   3.19    0.07%         3
ORCL  ORACLE CORP                         415,843    61,171    0.64   0.58   0.13   3.28    0.05%       106
BLDR  BUILDERS FIRSTSOURCE INC              8,162     2,302    0.50   0.41   0.22   3.55    0.02%        50
DOW   DOW INC                              21,384     9,420    0.44   0.31   0.31   3.75    0.01%        21
CCL   CARNIVAL CORP                        40,637    13,180    0.47   0.36   0.25   3.85    0.01%        40
VST   VISTRA CORP                          47,527    10,531    0.50   0.43   0.18   3.88    0.01%        68

TEN HEAVIEST DEBT LOADS, AND WHERE THE MODEL PUTS THEM
      company                         sector                        F/V  asset vol     DD  DD rank
------------------------------------------------------------------------------------------------------------
CHTR  CHARTER COMMUNICATIONS INC      Communication Services       0.74       0.17   1.88        1
KMX   CARMAX INC                      Consumer Discretionary       0.53       0.25   2.58        4
CZR   CAESARS ENTERTAINMENT INC DE    Consumer Discretionary       0.50       0.22   3.19        7
NCLH  NORWEGIAN CRUISE LINE HLDGS LTD Consumer Discretionary       0.47       0.30   2.48        3
PCG   P G & E CORP                    Utilities                    0.47       0.14   5.65       53
EIX   EDISON INTERNATIONAL            Utilities                    0.46       0.14   5.83       56
ES    EVERSOURCE ENERGY               Utilities                    0.37       0.16   6.29       78
EXC   EXELON CORP                     Utilities                    0.36       0.12   8.36      160
CAG   CONAGRA BRANDS INC              Consumer Staples             0.36       0.20   5.12       41
WYNN  WYNN RESORTS LTD                Consumer Discretionary       0.35       0.24   4.46       25

SECTOR MEDIANS
sector                      names     F/V  asset vol      DD
------------------------------------------------------------
Information Technology         62   0.035      0.449    6.86
Communication Services         15   0.138      0.281    7.14
Materials                      26   0.088      0.283    7.94
Consumer Staples               30   0.104      0.234    8.11
Consumer Discretionary         38   0.077      0.293    8.34
Energy                         20   0.120      0.276    8.49
Health Care                    50   0.092      0.283    8.77
Utilities                      29   0.278      0.137    9.55
Industrials                    70   0.062      0.278   10.53

Ranking agreement across 340 companies
  Spearman, DD against leverage                      0.514
  Spearman, DD against asset volatility              0.448
  Names in both the riskiest 20 by DD and by leverage    6 of 20
  Riskiest by leverage only: CAG, CMCSA, CMS, CPB, DTE, DUK, EIX, ES, EXC, FE, PCG, PNW, VZ, WYNN
  Riskiest by DD only:       APTV, BLDR, CCL, DOW, INTC, KLAC, LITE, LYB, MOS, ON, ORCL, SMCI, UAL, VST
  Distance to default: median 8.61, 5th percentile 4.07, 95th 16.48

SENSITIVITY OF THE RANKING
  risk-free rate 2%                  mean |change| in DD  0.04   riskiest-20 held 20 of 20   Spearman 1.000
  risk-free rate 6%                  mean |change| in DD  0.05   riskiest-20 held 20 of 20   Spearman 1.000
  default point + short-term debt    mean |change| in DD  0.40   riskiest-20 held 18 of 20   Spearman 0.983
  6-month estimation window          mean |change| in DD  0.99   riskiest-20 held 17 of 20   Spearman 0.962
What this tells us
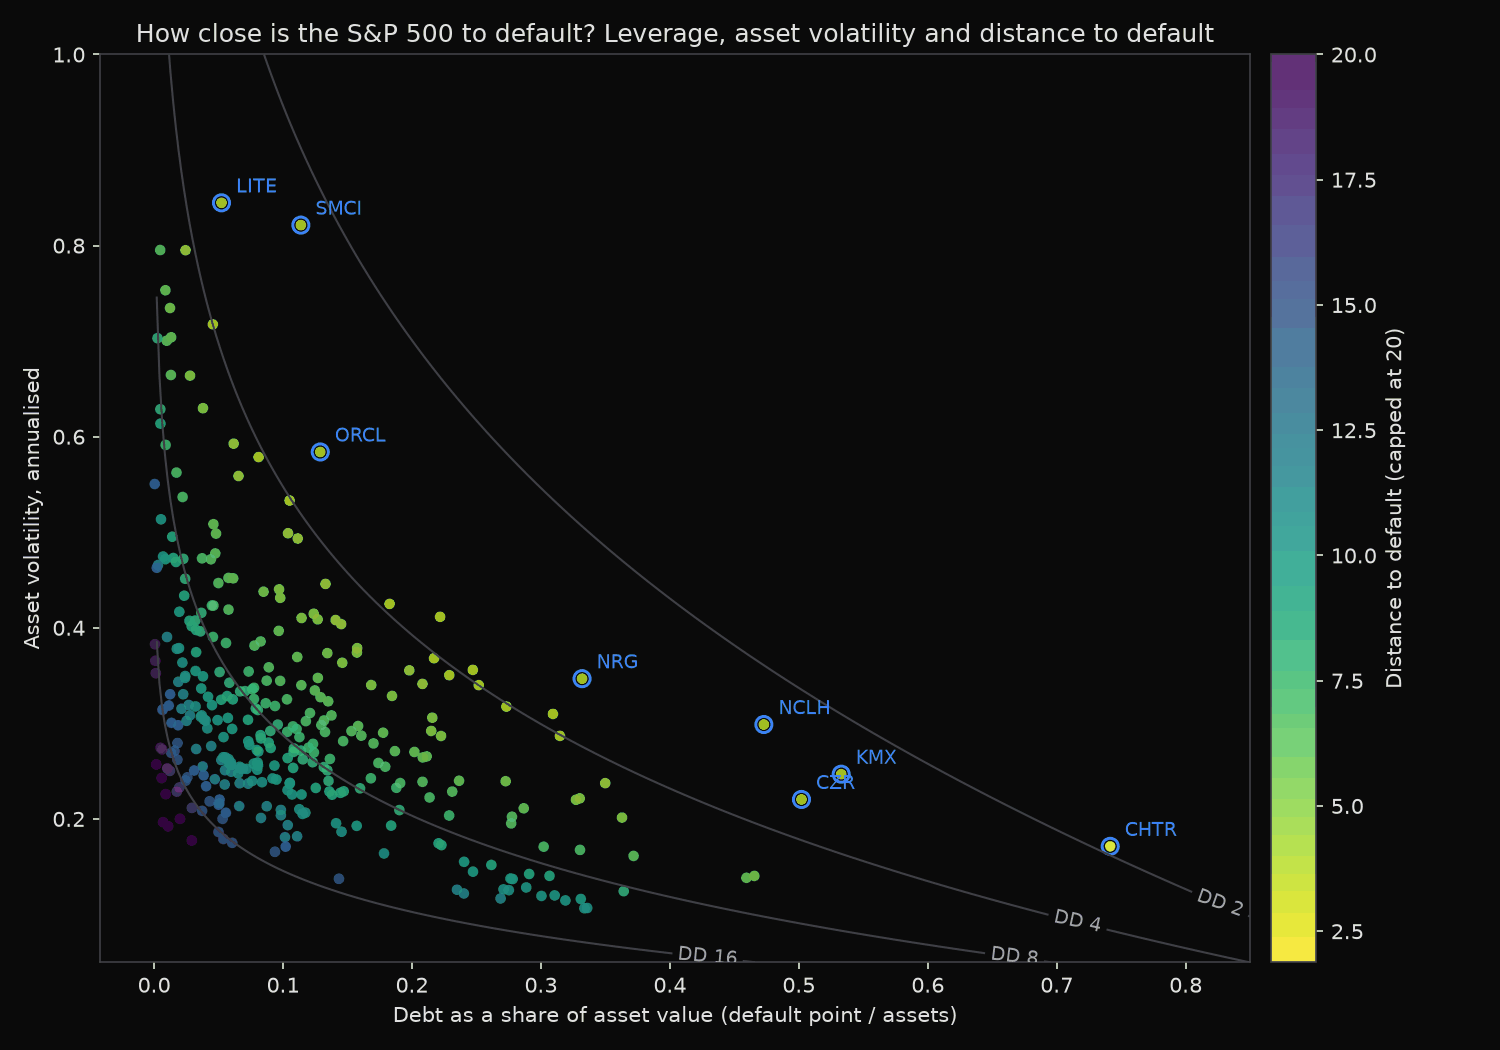
The two rankings disagree. Distance to default and leverage correlate at 0.514 across 340 companies, and only 6 of the 20 names flagged riskiest by one measure appear in the other’s twenty. Position on the plane fixes distance to default, so the grey curves on the chart are lines of equal credit risk, and they bend sharply: a company moves along one by trading debt for volatility. Charter Communications sits at the bottom right, the heaviest debt load in the sample at 74% of asset value against a cable network’s 17% asset volatility. Super Micro Computer sits at the top left, debt at 11% of assets and asset volatility at 82%. Both land inside a distance to default of 2.3.
Utilities make the point in aggregate. They carry the most debt, a median of 27.8% of asset value against 3.5% in information technology, and the model still ranks them second safest, because their median asset volatility of 13.7% is under a third of technology’s 44.9%.
The implied probabilities deserve less weight than the ordering. A risk-neutral 3.00% for Charter sits far above what its bond spreads imply, since the calculation prices default risk rather than forecasting it, and the model grants the firm one maturity and no refinancing. Bharath and Shumway (2008) found the ordering carries the predictive content, not the level.
The sensitivity checks say the ordering is stable. Moving the risk-free rate between 2% and 6% shifts distance to default by 0.05 on average and leaves the riskiest 20 untouched; adding short-term borrowings to the default point costs 0.40 and keeps 18. Halving the estimation window costs 0.99 and keeps 17, so the estimate carries about a point of noise from the volatility input alone.
So what?
Use the measure as a screen rather than a probability. A leverage sort cannot see how stable the business underneath is; this one does, and the disagreement list is where the work sits. Oracle, Intel and Vistra rank among the riskiest 20 by distance to default and nowhere near it by leverage, because asset volatility does the ranking there.
For a covenant or counterparty screen, read both coordinates rather than the single number: a firm at 0.74 leverage and 17% asset volatility needs refinancing capacity, one at 0.11 leverage and 82% volatility needs its equity to stop moving. A point of estimation noise also argues against reacting to small moves: a name drifting from 8.6 to 7.9 has said nothing, while one going from 6 to 3 has repriced.
Built with xfinlink — free financial data API for Python. pip install -U xfinlink
pip install -U xfinlink