
Is Volatility Seasonal? Calendar Month Analysis of Realized Volatility in Python
August 12, 2026
What’s the question?
Market lore gives every month a temperament. September is treacherous, October breaks things, and nothing happens in July. Risk desks act on this by trimming exposure into the autumn and letting hedges lapse over the summer.
Realized volatility makes the folklore testable: the standard deviation of daily returns inside a window, rescaled to annual terms. If the calendar carries information about risk, the same months should stand out repeatedly.
Two traps sit between the question and an answer. Crash anniversaries come first, since October 2008 and March 2020 dominate any average built from raw volatility levels, and one event can manufacture a month effect that never repeats. Double counting comes second, because eleven equity funds in the same October are close to one observation.
The approach
Eleven exchange-traded funds cover January 2005 to December 2025: SPY, DIA and IWM for US equities at three sizes, EFA and EEM for markets outside the US, XLK, XLE, XLF, XLP and XLU for sectors, and TLT for long Treasuries. Bonds and staples are here to break the story rather than support it: an effect driven by human scheduling ought to appear everywhere.
- Compute, for each fund and each calendar month, the annualised standard deviation of daily returns, keeping months with at least 15 trading days. That gives 2,772 fund-months.
- Express every fund-month in logs as a deviation from that fund’s average for the same year, so 2008 does not vote louder than 2017.
- Average the deviations by calendar month, taking the t-statistic from 21 yearly averages so correlated funds cannot inflate the sample.
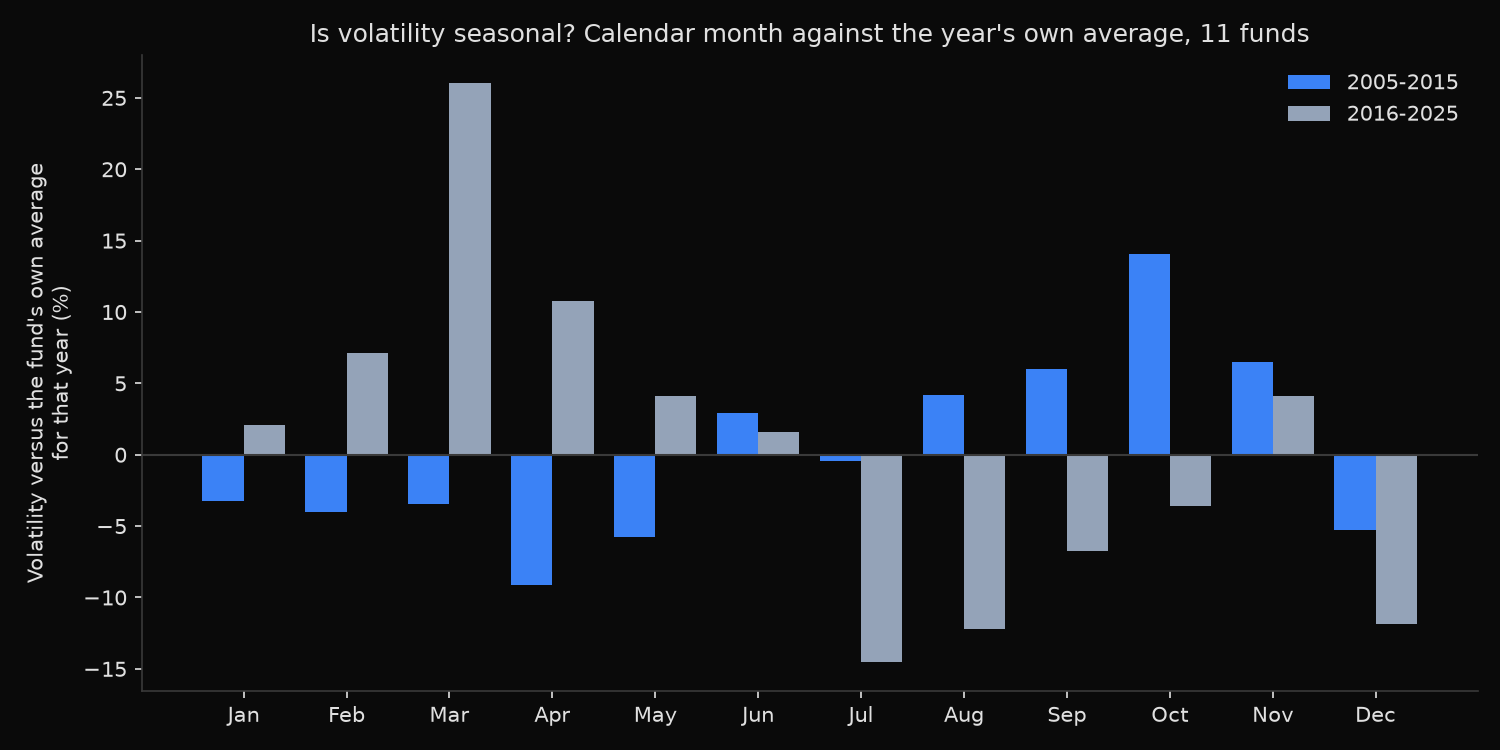
- Split at the end of 2015 and compare the halves, since an effect that reverses between them is noise with a shape.
- Set the calendar against the simplest rival forecast, the previous month’s volatility.
Code
import numpy as np
import pandas as pd
import xfinlink as xfl
from scipy import stats

xfl.set_api_key("YOUR_API_KEY")  # free at https://xfinlink.com/signup

tickers = ["SPY", "IWM", "EFA", "EEM", "TLT", "DIA", "XLK", "XLE", "XLF", "XLP", "XLU"]
px = xfl.prices(tickers, start="2005-01-01", end="2025-12-31",
                fields=["close", "return_daily"], max_rows=200000)
px["year"] = px["date"].dt.year
px["month"] = px["date"].dt.month

# annualised volatility of every fund-month, measured against that fund's own year
rv = (px.groupby(["ticker", "year", "month"])["return_daily"]
        .agg(days="size", sd="std").reset_index())
rv = rv[rv["days"] >= 15].copy()
rv["lv"] = np.log(rv["sd"] * np.sqrt(252) * 100)
rv["dev"] = rv["lv"] - rv.groupby(["ticker", "year"])["lv"].transform("mean")

for m in range(1, 13):
    sub = rv[rv["month"] == m]
    yearly = sub.groupby("year")["dev"].mean()   # one observation per year, not per fund
    t = yearly.mean() / (yearly.std(ddof=1) / np.sqrt(len(yearly)))
    print(f"month {m}: {100 * (np.exp(sub['dev'].mean()) - 1):6.2f}%   t {t:5.2f}")

h1 = rv[rv["year"] <= 2015].groupby("month")["dev"].mean()
h2 = rv[rv["year"] >= 2016].groupby("month")["dev"].mean()
print("rank correlation between the halves", round(stats.spearmanr(h1, h2).statistic, 2))
Full script with formatting and visualisation: is-volatility-seasonal-calendar-month-python.py
Output
SPY IWM EFA EEM TLT DIA XLK XLE XLF XLP XLU
daily returns 2005-01-03 to 2025-12-31, 58,113 bars, 2,772 fund-months, 5,283 bars per fund
realized volatility = annualised standard deviation of daily returns inside the calendar month
deviation = that month against the same fund's average for the same year

volatility by calendar month, 11 funds and 21 years pooled
month    avg vol   deviation       t   top-3 share
Jan       17.55%      -0.73%   -0.12         28.1%
Feb       17.71%       1.16%    0.23         26.0%
Mar       21.94%       9.60%    1.11         29.9%
Apr       18.24%      -0.13%   -0.02         23.8%
May       17.42%      -1.18%   -0.20         25.1%
Jun       17.89%       2.28%    0.38         32.0%
Jul       15.97%      -7.44%   -2.26         12.6%
Aug       17.29%      -3.96%   -0.52         23.8%
Sep       18.12%      -0.29%   -0.06         20.3%
Oct       20.51%       5.27%    0.74         26.4%
Nov       20.22%       5.38%    0.85         29.9%
Dec       16.47%      -8.46%   -1.29         22.1%
t is computed on 21 yearly averages, so the 11 funds inside a year count once
top-3 share = fund-years in which the month ranked among that year's three most volatile (25.0% if the calendar did not matter)

one-way test across the 12 months, treating every fund-month as an independent draw: F 5.69, p 4e-09

does the pattern repeat? deviation by half of the sample
month    2005-2015   2016-2025
Jan         -3.21%       2.06%
Feb         -4.00%       7.14%
Mar         -3.46%      26.01%
Apr         -9.11%      10.78%
May         -5.78%       4.15%
Jun          2.94%       1.56%
Jul         -0.47%     -14.55%
Aug          4.18%     -12.18%
Sep          5.97%      -6.74%
Oct         14.07%      -3.62%
Nov          6.51%       4.14%
Dec         -5.28%     -11.83%
rank correlation between the two halves -0.46 (p 0.13); the sign agrees in 4 of 12 months

deviation excluding 2008 and 2020
Jan 3.21%  Feb 2.67%  Mar 3.39%  Apr -0.44%  May 1.16%  Jun 3.29%  Jul -5.79%  Aug 0.40%  Sep -2.41%  Oct 1.79%  Nov 1.82%  Dec -8.28%
March 2020 alone deviates 296.3%; the 2016-2025 March figure is 26.01% with that year and 10.95% without it

the two claims fund by fund: a dangerous autumn and a quiet July
fund     Sep-Oct       Jul
DIA        1.95%   -10.13%
EEM        4.27%    -6.61%
EFA        0.97%    -4.69%
IWM       -0.77%    -6.67%
SPY        2.33%   -14.11%
TLT        1.96%    -3.12%
XLE        1.60%    -8.12%
XLF        1.95%    -8.54%
XLK        2.61%    -9.58%
XLP        4.04%    -7.69%
XLU        6.26%    -1.98%

what explains a fund-month's volatility (2,761 fund-months, each fund measured against its own average)
calendar month              R2 0.0116
previous month volatility   R2 0.4227
both together               R2 0.4390
What this tells us
One month separates itself, and it is not the one from the folklore. July runs 7.44% below its own fund-year with a t-statistic of -2.26, and ranks among a year’s three most volatile months in 12.6% of fund-years, half the 25.0% a blind calendar produces. December is quieter still at -8.46%, though its scatter leaves it at -1.29. September deviates by -0.29% and October by 5.27%, with t-statistics of -0.06 and 0.74.
The pooled one-way test returns F of 5.69 and a p-value of 4e-09, which would settle the matter if the fund-months were independent. Eleven funds share the same October, and once the sample collapses to 21 yearly averages only July clears a t-statistic of 2.
Stability is where the story comes apart. Ranking the months by deviation in each half gives a rank correlation of -0.46, with the sign agreeing in 4 of 12 months. October carried 14.07% above its year in 2005-2015 and -3.62% in 2016-2025. Even July owes most of its size to the second half, reading -14.55% against -0.47% in the first.
The raw averages mislead as the design anticipated. March posts the highest average volatility at 21.94%, and its 2016-2025 deviation of 26.01% falls to 10.95% once 2020 is set aside, a month in which the eleven funds averaged 296.3% above their own year. Excluding 2008 and 2020 leaves a calendar barely twelve percentage points wide, with December at -8.28% and July at -5.79% the only months outside the crowd. The autumn is consistent in direction and trivial in size, positive in 10 of 11 funds and largest at 6.26% in utilities, while July is negative in all eleven. Calendar month explains 1.16% of the variation in fund-month volatility against 42.27% for the previous month, roughly 36 times as much.
So what?
Do not budget risk by the calendar. A rule that cuts equity exposure into September and restores it in November trades on a pattern that reverses between the halves of this sample, and costs would consume the difference even if the sign held.
Persistence is the signal worth acting on. Last month’s realized volatility carries most of what is knowable about next month’s, so size positions from an estimate that updates continuously rather than from a calendar fixed in advance.
July is the one calendar effect worth keeping, with conditions: expect roughly 5% to 8% below the year’s own average, not a change of regime, and treat the past decade as the source of most of that gap.
The method transfers to any seasonal claim: demean within the year, count correlated assets once, then split the sample. A pattern that reaches significance only when eleven versions of one market are counted separately has not been found.
Built with xfinlink — free financial data API for Python. pip install -U xfinlink
pip install -U xfinlink