
What’s the question?
Asset growth is the year-over-year percentage change in a company’s total assets. It is blunt by design: acquisitions, factory construction, inventory builds and cash raised from a bond sale all push it up together. One number records how much bigger the balance sheet became, without asking how.
Cooper, Gulen and Schill published evidence in 2008 that this blunt number predicted returns better than most refined ones. Companies in the fastest-growing decile of assets went on to deliver the weakest subsequent returns, and companies that shrank their balance sheets did best. The proposed mechanism was overinvestment: capital is easiest to raise when a business is popular, managers spend what they raise, and the spending disappoints.
That work covered the whole US market, where small companies dominate the count. The S&P 500 is a different population of large, heavily analysed businesses. Two questions follow: does the pattern survive there, and if it does, where in the distribution does it live?
The approach
- Take the point-in-time S&P 500 roster at each 30 June from 2016 to 2025 through the
as_ofparameter, so companies that later left the index still enter the sample for the years they were members - Pull annual balance sheets for every company that was a member at least once, addressed by entity id rather than ticker, so a reassigned symbol cannot enter
- At each formation date take the most recent fiscal year ending on or before 31 December of the previous year, leaving a reporting lag of at least six months
- Compute asset growth against the prior fiscal year, requiring period ends 300 to 430 days apart and both asset bases above $10m
- Measure the forward 12-month price return from 30 June to 30 June, again by entity id; members that stopped trading inside the year use their final close
- Rank into quintiles and deciles inside each formation year, and winsorise returns at the 1st and 99th percentile of each cohort so one extreme move cannot set a group mean
That leaves 4,926 company-years drawn from 644 companies.
Code
import numpy as np
import pandas as pd
import xfinlink as xfl

xfl.set_api_key("YOUR_API_KEY")  # free at https://xfinlink.com/signup

YEARS = list(range(2016, 2026))

rosters = {y: xfl.index("sp500", as_of=f"{y}-06-30") for y in YEARS}
universe = sorted({int(e) for r in rosters.values() for e in r["entity_id"]})

fun = pd.concat([xfl.fundamentals(entity_id=universe[i:i + 60], period_type="annual",
                                  fields=["total_assets"], start="2013-01-01",
                                  end="2025-12-31", max_rows=200000)
                 for i in range(0, len(universe), 60)], ignore_index=True)
fun["period_end"] = pd.to_datetime(fun["period_end"])
fun = fun.dropna(subset=["total_assets"]).sort_values(["entity_id", "period_end"])
fun["prev_assets"] = fun.groupby("entity_id")["total_assets"].shift(1)
gap = (fun["period_end"] - fun.groupby("entity_id")["period_end"].shift(1)).dt.days
fun = fun[(gap >= 300) & (gap <= 430) & (fun["prev_assets"] >= 10)
          & (fun["total_assets"] >= 10)].copy()
fun["asset_growth"] = fun["total_assets"] / fun["prev_assets"] - 1.0

signal = []
for year in YEARS:
    ids = {int(e) for e in rosters[year]["entity_id"]}
    known = fun[fun["entity_id"].isin(ids) & (fun["period_end"] <= f"{year - 1}-12-31")]
    latest = known.sort_values("period_end").groupby("entity_id").tail(1).copy()
    latest["form_year"] = year
    signal.append(latest[["entity_id", "form_year", "asset_growth"]])
signal = pd.concat(signal, ignore_index=True)

# anchors[year][entity_id] = last adjusted close on or before 30 June of that year
d = signal.dropna(subset=["p0", "p1"]).copy()
d["raw"] = d["p1"] / d["p0"] - 1.0
d["fwd"] = d.groupby("form_year")["raw"].transform(
    lambda s: s.clip(s.quantile(0.01), s.quantile(0.99)))
d["decile"] = d.groupby("form_year")["asset_growth"].transform(
    lambda s: pd.qcut(s.rank(method="first"), 10, labels=range(1, 11)).astype(int))

print(d.groupby("decile")["fwd"].agg(["size", "mean", "median"]))

big = d["asset_growth"] > 0.50
print(d.groupby(big)["fwd"].mean())
Full script with formatting and visualisation: asset-growth-forward-returns-sp500-python.py
Output
Point-in-time S&P 500 rosters, 30 June 2016 to 30 June 2025
  distinct companies that were members at least once: 665
  company-years with a signal and a forward return: 4,926
  forward returns winsorised at the 1st and 99th percentile of each cohort: 100 values adjusted

Forward 12-month return by asset-growth quintile, all cohorts pooled
  quintile          median asset growth   mean return   median return      n
  Q1 slowest                  -5.7%        10.93%           6.81%    990
  Q2                           0.4%        10.86%           5.21%    983
  Q3                           4.4%        12.04%           6.75%    981
  Q4                           9.2%        12.53%           9.02%    983
  Q5 fastest                  25.0%         9.71%           8.60%    989
  Q1 minus Q5: mean +1.19 pp, median -0.57 pp, positive in 4 of 10 cohorts

Same sort into deciles
  decile   median asset growth   mean return   median return      n
  D1                -10.9%        11.24%           7.76%    496
  D2                 -3.1%        10.62%           6.20%    494
  D3                 -0.5%        12.00%           7.02%    489
  D4                  1.5%         9.73%           4.70%    494
  D5                  3.3%        12.86%           6.16%    494
  D6                  5.2%        11.21%           7.26%    487
  D7                  7.5%        13.63%           8.97%    494
  D8                 10.6%        11.41%           9.35%    489
  D9                 18.2%        11.24%           8.88%    494
  D10                41.3%         8.19%           7.25%    495

Companies whose total assets grew more than 50% in one fiscal year
  185 company-years across 11 sectors
  mean forward return   1.03%   median   2.28%
  rest of the index    11.61%   median   7.62%
  trailed the rest of the index in 8 of 10 cohorts
  cohort gap, percentage points:
    2016   -10.85
    2017   -11.93
    2018    -7.16
    2019    -5.90
    2020   -19.34
    2021   -10.44
    2022   -13.06
    2023    +9.27
    2024    +0.45
    2025   -13.51
What this tells us
As a factor tilt, asset growth carries nothing. Mean forward returns by quintile run 10.93, 10.86, 12.04, 12.53 and 9.71 per cent, which is not a slope in any direction, and the Q1-minus-Q5 spread was positive in only 4 of the 10 cohorts. Median returns rise across the sort rather than falling, from 6.81 per cent in the slowest quintile to 8.60 per cent in the fastest. The average spread of 1.19 percentage points a year came from a signal that pointed the wrong way half the time.
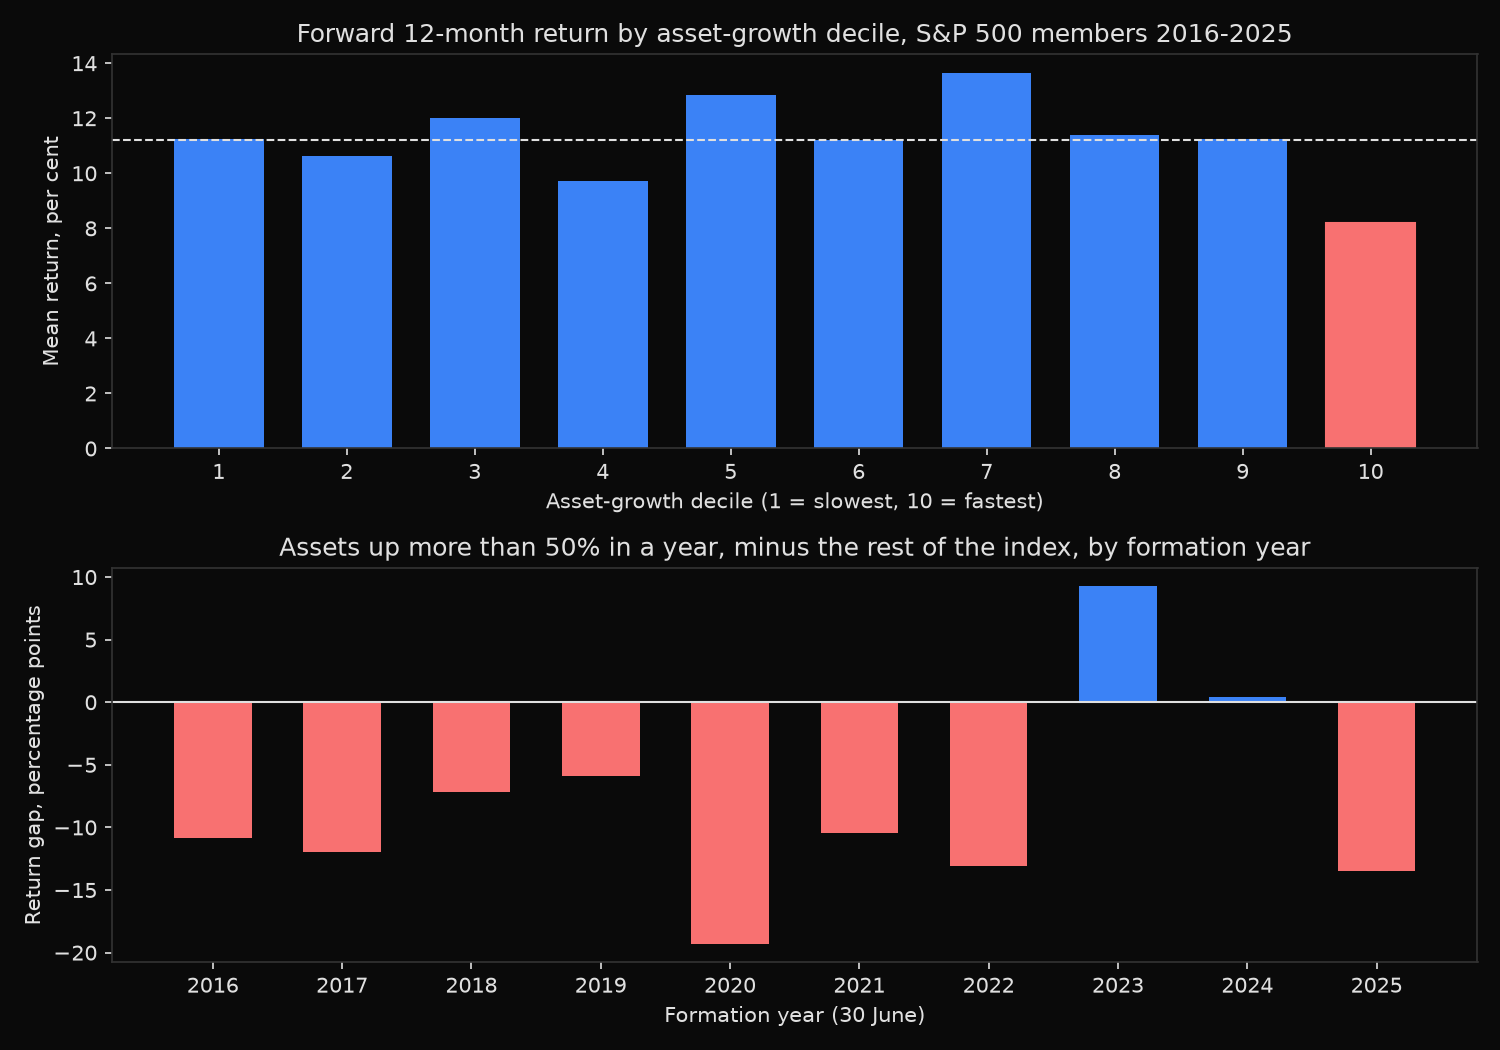
The decile view locates what the quintiles blur. Deciles 1 through 9 sit in a band from 9.73 to 13.63 per cent with no order inside it. Decile 10, at 8.19 per cent, is the only group outside that band, and its median company grew assets by 41.3 per cent.
Cutting at a fixed threshold sharpens the point. The 185 company-years where total assets grew by more than half in one fiscal year returned a mean of 1.03 per cent over the following twelve months, against 11.61 per cent for the other 4,741. They trailed in 8 of the 10 cohorts, by 19.34 percentage points in the cohort formed 30 June 2020, and they span all 11 sectors, so this is not one industry’s cycle wearing a balance-sheet disguise.
The mechanism is visible in what expanding a balance sheet by half in twelve months requires. Organic demand almost never does it. Large acquisitions, debt-funded construction and equity raises do, and each arrives with integration risk, goodwill that may later be written down, and interest that must be paid whatever revenue does.
So what?
Do not build a factor on this. A quintile tilt would have paid roughly one percentage point a year with a coin-flip hit rate, which is indistinguishable from nothing once costs are counted.
Use it as a screen instead. A rule that flags any holding whose total assets grew more than 50 per cent in its latest reported fiscal year catches about 18 S&P 500 names a year, and those names earned roughly a tenth of what the rest of the index earned. The right response is position sizing rather than direction: the group’s mean return is positive, so shorting it is not the trade. Trimming the weight is.
The flag pairs naturally with a look at how the growth was funded, since assets grown out of retained earnings tell a different story from assets grown out of a bond issue.
Built with xfinlink — free financial data API for Python.