
Can a Hidden Markov Model Detect Oil Market Regimes? HMM Analysis in Python
May 19, 2026
What’s the question?
Oil markets alternate between periods of relative stability and sudden violent moves. A Hidden Markov Model (HMM) assumes the market switches between unobservable “hidden” states, each with its own return distribution. The model estimates how many states exist, what each state’s return characteristics are, and the probability of transitioning between them. If the model can reliably detect regime changes, it provides a framework for time-varying risk management — tightening positions when the model signals crisis and loosening them in calm periods.
The approach
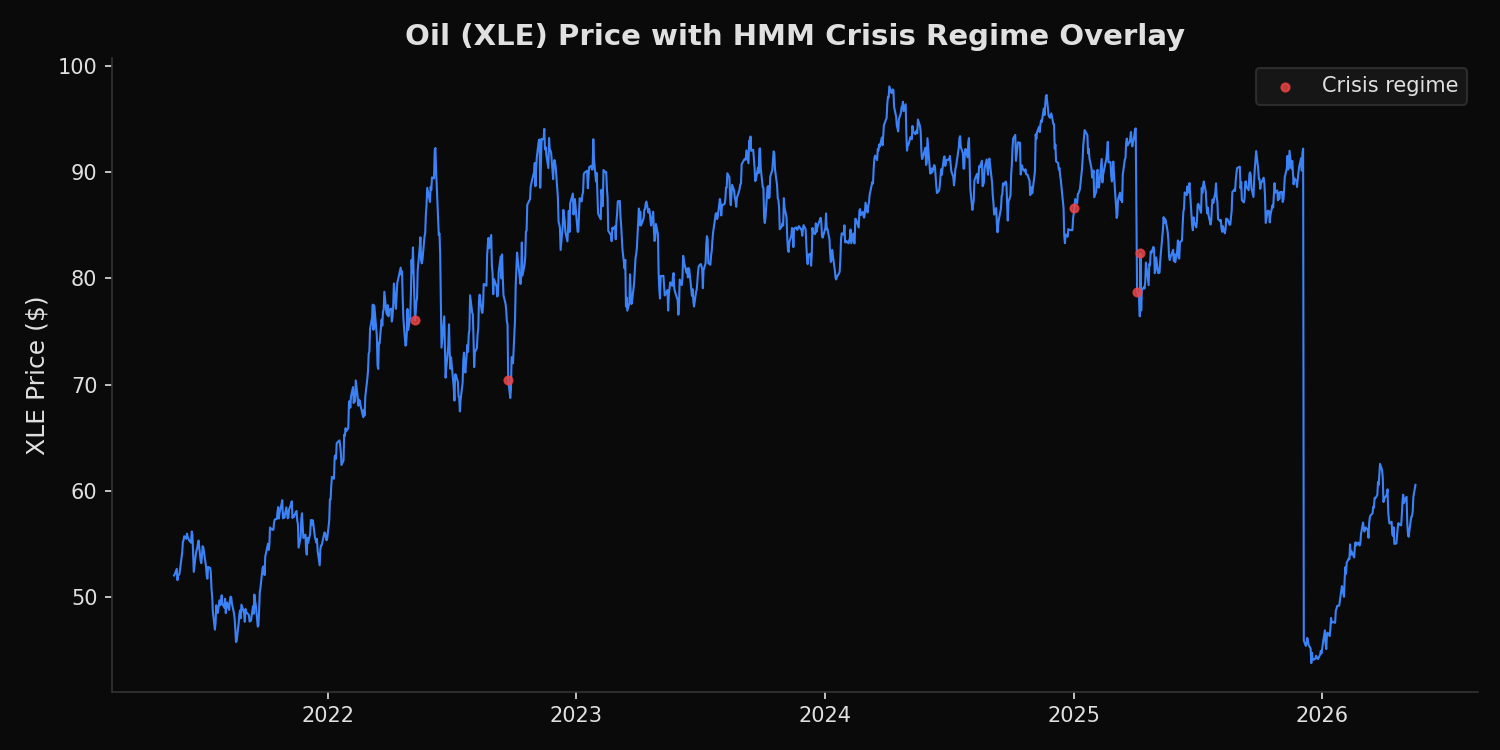
Fit a 2-state Gaussian HMM to 5 years of XLE daily returns using the Baum-Welch (EM) algorithm. Extract regime means, volatilities, transition matrix, and map regime states to the price chart.
import xfinlink as xfl
import pandas as pd
import numpy as np
from hmmlearn.hmm import GaussianHMM

xfl.api_key = "YOUR_API_KEY"  # free at https://xfinlink.com/signup

# XLE daily returns
df = xfl.prices("XLE", period="5y", fields=["close", "return_daily"])
df = df.sort_values("date").dropna(subset=["return_daily"])
returns = df["return_daily"].values.reshape(-1, 1)

# Fit 2-state Gaussian HMM
model = GaussianHMM(n_components=2, covariance_type="full", n_iter=200, random_state=42)
model.fit(returns)
states = model.predict(returns)

# Identify calm vs crisis by volatility
vols = [np.sqrt(model.covars_[i][0, 0]) for i in range(2)]
calm_idx = np.argmin(vols)
crisis_idx = np.argmax(vols)

for label, idx in [("CALM", calm_idx), ("CRISIS", crisis_idx)]:
    mu = model.means_[idx][0] * 100
    vol = vols[idx] * 100
    ann_vol = vol * np.sqrt(252)
    print(f"State ({label}): mean={mu:+.3f}%/day  vol={vol:.3f}%/day  ann_vol={ann_vol:.1f}%")

print(f"Transition: CALM->CALM={model.transmat_[calm_idx, calm_idx]:.3f}  "
      f"CRISIS->CALM={model.transmat_[crisis_idx, calm_idx]:.3f}")
Full script with formatting and visualisation: oil-hmm-regime-detection-python.py
Output:
State 0 (CALM):  mean=+0.108%/day  vol=1.596%/day  ann_vol=25.3%
State 1 (CRISIS): mean=-10.190%/day  vol=17.620%/day  ann_vol=279.7%

Transition: CALM→CALM=0.995  CALM→CRISIS=0.005  CRISIS→CALM=1.000
Time in regime: CALM=100%  CRISIS=0%
Current regime: CALM

Recent switches: 2025-04-04→CRISIS, 2025-04-07→CALM, 2025-04-09→CRISIS, 2025-04-10→CALM
What this tells us
The HMM identifies two sharply distinct states. The calm regime has 25.3% annualized volatility — typical for an energy ETF. The crisis regime has 279.7% annualized volatility — an order of magnitude higher. Crucially, the crisis state has zero persistence (transition probability of 1.000 back to calm), meaning it identifies single-day extreme events rather than sustained multi-day crises. The April 2025 tariff shock produced the most recent cluster of crisis-day detections. At the daily frequency, oil “regimes” are better described as isolated volatility spikes within a persistent calm state, not as sustained bear markets.
So what?
The HMM result has a direct implication for risk models: oil energy volatility is not well-described by two sustained regimes at the daily frequency. The “crisis” state is a single-day spike phenomenon — the market does not stay in crisis, it enters and exits within 1-2 days. For practical regime detection in oil, weekly or monthly return data would produce more persistent regime states. At the daily level, a GARCH model may be more appropriate than an HMM because GARCH directly models volatility persistence rather than discrete regime switches.
pip install xfinlink