
Does Goodwill Distort the Price-to-Book Screen? Goodwill-Adjusted Valuation in Python
August 2, 2026
What's the question?
Price-to-book divides market capitalisation by shareholders’ equity, the accounting residual left to owners once every liability is settled. It is the oldest ratio in professional value investing and still the denominator behind the academic value factor, and investors read a low number as paying little for each dollar of net assets.
Book equity is not an appraisal. It accumulates historical costs, and one of the largest entries inside it is goodwill: the premium an acquirer paid above the fair value of the identifiable assets it bought, capitalised as an asset of its own. Goodwill cannot be sold separately or pledged, and it leaves the balance sheet only through impairment, which is a write-off rather than a realisation.
A company built by acquisition therefore carries book equity that an internally built rival does not, so ranking on stated book means partly ranking on deal history. The test below asks how much of the cheap end of a price-to-book screen stays cheap once goodwill comes out of the denominator.
The approach
The universe is the S&P 500 as it stands today, with financials and real estate set aside because book value means something different for a balance sheet made of loans and securities.
- Take, for each company in the current roster, the most recent filing stating both shareholders’ equity and goodwill, provided it falls within thirteen months of the market data.
- Read market capitalisation from the daily series dated 31 July 2026, and take the trading symbol from the price series keyed on entity identifier, so a renamed company keeps the symbol it trades under now.
- Require positive book equity and a market capitalisation above one billion dollars.
- Compute goodwill as a share of book equity, then both ratios: market capitalisation over stated book, and over book excluding goodwill.
- Rank the names retaining positive book excluding goodwill into quintiles twice, once on each ratio, and measure the movement with a Spearman rank correlation.
Companies whose goodwill exceeds their entire book equity are counted separately rather than ranked, since tangible net worth is negative and no positive price is either cheap or expensive against a negative denominator.
Code
import pandas as pd
from scipy.stats import spearmanr
import xfinlink as xfl

xfl.set_api_key("YOUR_API_KEY")  # free at https://xfinlink.com/signup

members = xfl.index("sp500")
tickers = sorted(members["ticker"].dropna().unique().tolist())

fund = xfl.fundamentals(tickers, period_type="all", period="2y",
                        fields=["total_equity", "goodwill"])
stated = fund[fund["total_equity"].notna() & fund["goodwill"].notna()]
book = stated.sort_values("period_end").groupby("entity_id").tail(1)

caps = xfl.metrics(tickers, period_type="daily", fields=["market_cap"], period="1w")
caps = caps.sort_values("period_end").groupby("entity_id").tail(1)
price_date = caps["period_end"].max()

px = xfl.prices(tickers, period="1w", fields=["close"])
sym = px.sort_values("date").groupby("entity_id").tail(1)[["entity_id", "ticker"]]

book = book[book["period_end"] >= price_date - pd.DateOffset(months=13)]
book = book[~book["gics_sector"].isin(["Financials", "Real Estate"])]

df = book.merge(sym, on="entity_id", how="left", suffixes=("_roster", ""))
df["ticker"] = df["ticker"].fillna(df["ticker_roster"])
df = df.merge(caps[["entity_id", "market_cap"]], on="entity_id")
df = df[(df["total_equity"] > 0) & (df["market_cap"] >= 1000)].copy()

df["gw_share"] = df["goodwill"] / df["total_equity"]
df["book_ex"] = df["total_equity"] - df["goodwill"]
df["pb"] = df["market_cap"] / df["total_equity"]

tan = df[df["book_ex"] > 0].copy()
tan["pb_ex"] = tan["market_cap"] / tan["book_ex"]
tan["q_pb"] = pd.qcut(tan["pb"].rank(method="first"), 5, labels=[1, 2, 3, 4, 5]).astype(int)
tan["q_ex"] = pd.qcut(tan["pb_ex"].rank(method="first"), 5, labels=[1, 2, 3, 4, 5]).astype(int)

rho, pval = spearmanr(tan["pb"], tan["pb_ex"])
print(f"no tangible net worth: {(df['book_ex'] <= 0).sum()} of {len(df)}")
print(f"median goodwill share of book equity: {df['gw_share'].median():.2f}")
print(f"Spearman, P/B vs P/B ex-goodwill: {rho:.3f}  p = {pval:.1e}")
print(tan[tan["q_pb"] == 1]["q_ex"].value_counts().sort_index())
Full script with formatting and visualisation: goodwill-adjusted-price-to-book-python.py
Output
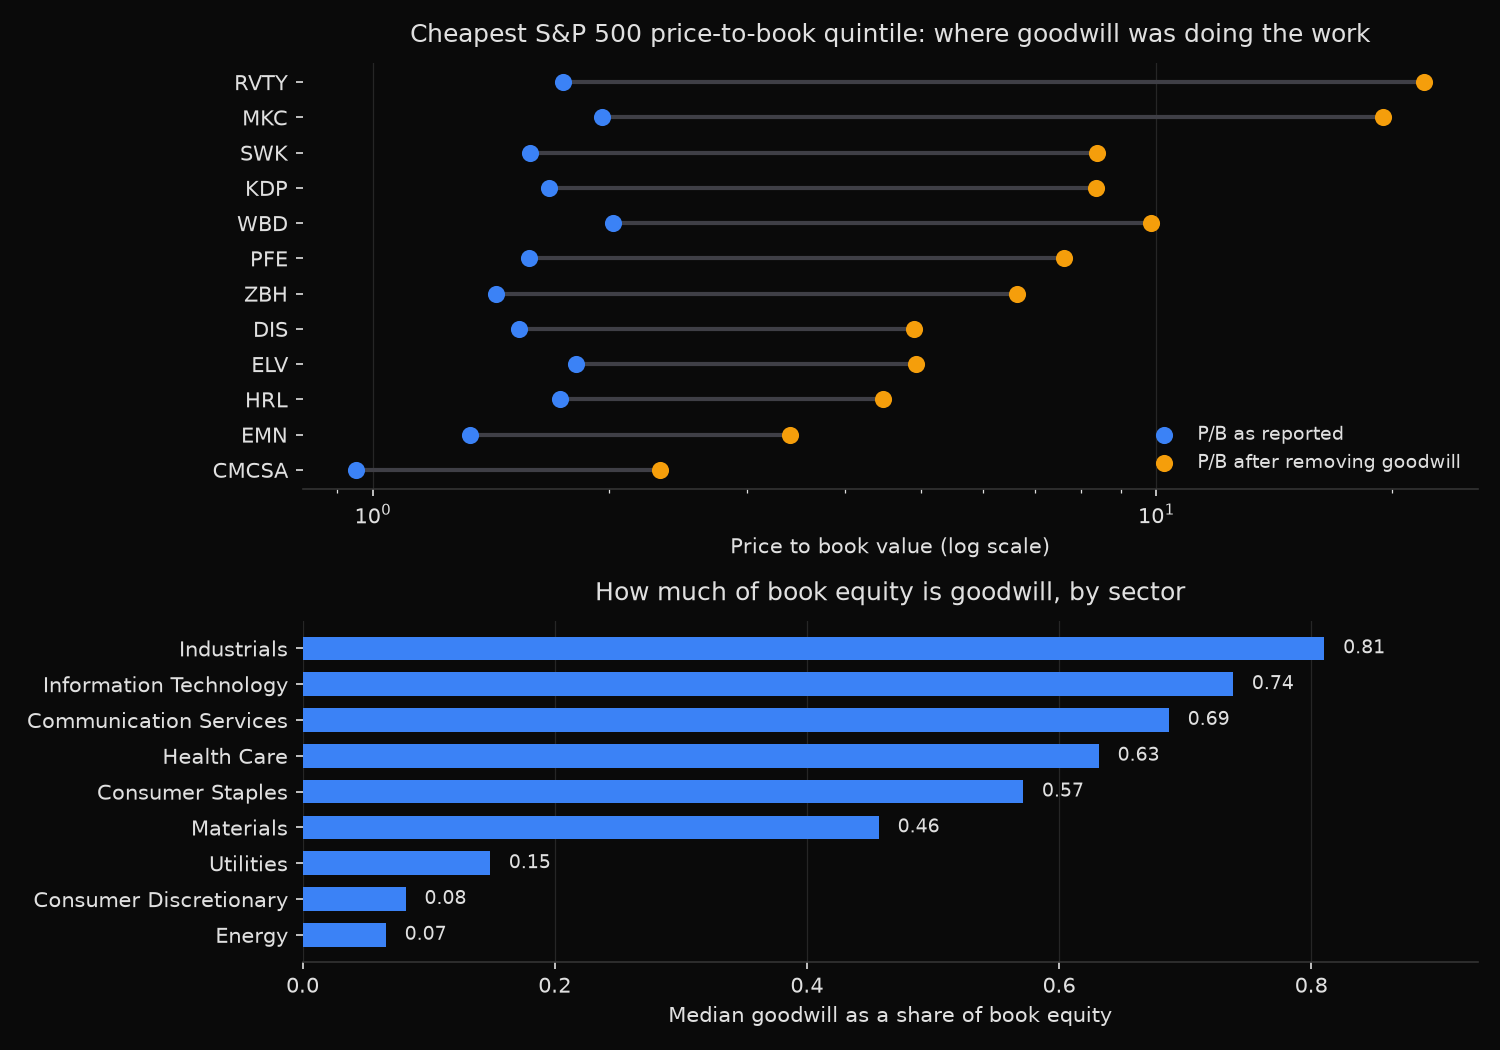
Goodwill and the price-to-book screen, S&P 500, market data 2026-07-31
Book equity: latest filing stating both shareholders' equity and goodwill, on or after 2025-06-30
Sample: 310 members with positive book equity and a market capitalisation above $1,000m, outside Financials and Real Estate

Median goodwill as a share of book equity: 0.53
Goodwill larger than the whole of book equity: 67 names (21.6%) -- no tangible net worth, no ratio to compute
Of the 62 names in the cheapest reported-P/B quintile, 9 are in that group

Ranking test on the 243 names that keep tangible net worth
  median P/B 4.13, median P/B ex-goodwill 8.89
  Spearman rank correlation between the two: 0.750  p = 3.7e-45
  137 of 243 names change quintile
  cheapest P/B quintile (49 names) lands as:
     quintile 1 (cheapest)          34
     quintile 2                      9
     quintile 3                      4
     quintile 4                      2
     quintile 5 (most expensive)     0

Cheapest reported-P/B quintile, names whose book equity is entirely goodwill
Ticker  Sector                     P/B  GW/Book    Book $m  Book ex-GW $m
CZR     Consumer Discretionary    1.77     3.06    3,416.0       -7,025.0
CHTR    Communication Services    1.03     1.75   16,952.0      -12,758.0
CPB     Consumer Staples          1.64     1.25    4,005.0         -987.0
ROP     Information Technology    2.13     1.13   18,818.0       -2,529.7
CVS     Health Care               1.72     1.10   77,456.0       -8,022.0
BDX     Health Care               1.89     1.08   24,133.0       -1,822.0
CI      Health Care               1.73     1.07   42,620.0       -2,914.0
BLDR    Industrials               1.78     1.04    4,005.2         -144.8
AMCR    Materials                 1.78     1.03   11,651.0         -304.0

Cheapest-quintile names that survive the adjustment, most goodwill first
Ticker  Sector                     P/B  GW/Book  P/B ex-GW  Quintile
RVTY    Health Care               1.75     0.92      21.96         4
MKC     Consumer Staples          1.96     0.90      19.47         4
SWK     Industrials               1.58     0.81       8.39         3
KDP     Consumer Staples          1.68     0.80       8.38         3
WBD     Communication Services    2.02     0.79       9.84         3
PFE     Health Care               1.58     0.79       7.63         3
ZBH     Health Care               1.43     0.78       6.63         2
DIS     Communication Services    1.54     0.69       4.91         2
ELV     Health Care               1.82     0.63       4.93         2
HRL     Consumer Staples          1.73     0.61       4.47         2

Goodwill in book equity by sector
Sector                      n  GW/Book  No tangible     P/B  P/B ex-GW
Industrials                63     0.81           20    5.84      19.15
Information Technology     59     0.74           16    8.80      20.47
Communication Services     15     0.69            5    3.30       5.68
Health Care                47     0.63           12    3.54       9.16
Consumer Staples           28     0.57            5    3.76      12.44
Materials                  26     0.46            2    2.77       4.10
Utilities                  22     0.15            1    2.22       2.57
Consumer Discretionary     36     0.08            6    6.04       7.57
Energy                     14     0.07            0    2.70       3.92
What this tells us
Goodwill is not a rounding item in large-cap book value. The median company funds 53 cents of every dollar of stated equity with it, and for 67 names, 21.6 percent of the sample, goodwill exceeds the whole of book equity. Those companies carry negative tangible net worth: identifiable assets do not cover liabilities, and the balance sheet balances only because a past acquisition premium sits on the asset side.
Nine of them screen inside the cheapest fifth of reported price-to-book. Caesars Entertainment shows book equity of 3.4 billion dollars against goodwill of 10.4 billion, so its ratio of 1.77 rests on a figure that is 7.0 billion negative once the premium comes out. CVS Health, Cigna, Becton Dickinson, and Charter Communications sit in the same position.
Among the 243 names that keep tangible net worth, the two rankings agree well but not closely: Spearman correlation of 0.750, with 137 of 243 changing quintile. Thirty-four of the 49 cheapest names stay cheapest after the adjustment and none drop to the most expensive quintile, since reordering that far takes a very high goodwill share. Revvity moves from 1.75 to 21.96 and McCormick from 1.96 to 19.47, both on goodwill shares near 0.90.
The sector pattern follows deal history rather than business model. Industrials post a median goodwill share of 0.81 with 20 of 63 names showing no tangible net worth; information technology follows at 0.74 with 16 of 59. Energy sits at 0.07 and consumer discretionary at 0.08, since drilling rigs and store fleets are built, not bought. Any screen ranking the whole market on stated book tilts quietly toward the sectors that acquire.
So what?
Run the screen on both denominators and compare the lists before buying at the cheap end. A name cheap on both measures is cheap against assets that exist; a name appearing only on the stated-book list is cheap against a price some acquirer once paid, which says nothing about what the combination is worth today.
Treat the negative tangible net worth group as its own category rather than as missing data. Sorting software usually drops those 67 names or hands them a null, removing the most acquisition-heavy fifth of the market from the ranking. They belong at the expensive end, and impairment exposure is what to size: a write-down leaves cash untouched but cuts reported equity, and covenants are written against reported equity.
For factor construction, the denominator is a design decision worth documenting. Book-to-market built on stated equity loads on acquisition accounting alongside valuation, one reason the value factor behaves differently across sectors. Rebuilding it on book excluding goodwill changes one line and moves 137 of 243 names into a different quintile.
Built with xfinlink — free financial data API for Python. pip install -U xfinlink
pip install -U xfinlink