
Does Rebalancing Add Return? Fixed-Weight vs Drift Portfolios in Python
August 7, 2026
What’s the question?
Rebalancing means periodically selling whatever has grown beyond its target weight and buying whatever has fallen below it, returning the portfolio to the allocation originally chosen. Every textbook recommends it. Two separate claims usually travel together in that recommendation, and only one of them is obviously true.
The first claim is about risk: without rebalancing, a portfolio drifts toward whatever performed best, so the investor ends up holding an allocation nobody chose. That follows from arithmetic. The second claim is stronger and worth testing: rebalancing is supposed to add return, because selling winners and buying losers harvests mean reversion. This is often called the rebalancing bonus.
If the bonus is dependable, the schedule becomes a source of return in its own right, and trading more often should capture more of it. If it is not, rebalancing is purely a risk decision and should be argued on those grounds.
The approach
The test portfolio holds five sleeves at equal weight: US equity, developed international, emerging markets, long Treasuries, and US real estate. Equal weighting across assets with genuinely different drivers gives mean reversion the best chance to show up, which is the fair way to test a hypothesis rather than to dismiss it.
- Pull daily total returns for all five funds from 2005 to the end of 2024 and keep sessions where every fund trades.
- Simulate six policies: never rebalancing, monthly, quarterly, annually, and threshold bands that trade only when a sleeve strays more than 5 or 10 percentage points from its target.
- Record annual return, volatility, worst drawdown, the number of rebalances, and annual turnover for each.
- Repeat on a 60/40 portfolio of US equity and long Treasuries, where one sleeve outperformed the other by a wide margin.
- Split the record into 2005-2014 and 2015-2024 to test whether any advantage is stable.
Turnover is measured one way, as half the sum of absolute weight changes, so a figure of 10% means a tenth of the portfolio changed hands.
Code
import numpy as np
import pandas as pd
import xfinlink as xfl

xfl.set_api_key("YOUR_API_KEY")  # free at https://xfinlink.com/signup

SLEEVES = ["SPY", "EFA", "EEM", "TLT", "VNQ"]
rets = pd.DataFrame({
    t: (xfl.prices(t, start="2005-01-01", end="2024-12-31",
                   fields=["close", "return_daily"])
        .assign(date=lambda d: pd.to_datetime(d["date"]))
        .sort_values("date").set_index("date")["return_daily"])
    for t in SLEEVES}).dropna()

def simulate(rets, target, rule):
    w0 = np.full(rets.shape[1], target)
    w, total, vals = w0.copy(), 1.0, []
    marks = None if rule in ("none",) or isinstance(rule, tuple) else         set(rets.index.to_series().resample(rule).last().dropna())
    for dt, row in rets.iterrows():
        w = w * (1.0 + row.values)
        growth = w.sum()
        total *= growth
        vals.append(total)
        w = w / growth
        drifted = isinstance(rule, tuple) and np.abs(w - w0).max() > rule[1]
        if drifted or (marks is not None and dt in marks):
            w = w0.copy()
    return pd.Series(vals, index=rets.index)

for name, rule in [("Never", "none"), ("Monthly", "ME"), ("Annually", "YE"),
                   ("10% band", ("band", 0.10))]:
    c = simulate(rets, 0.2, rule)
    yrs = (c.index[-1] - c.index[0]).days / 365.25
    print(f"{name:10s} CAGR {(c.iloc[-1] ** (1/yrs) - 1) * 100:.2f}%  "
          f"maxDD {(c / c.cummax() - 1).min() * 100:.2f}%")
Full script with formatting and visualisation: portfolio-rebalancing-premium-python.py
Output
5033 common sessions, 2005-01-03 to 2024-12-31
sleeves: SPY (US equity), EFA (Developed intl), EEM (Emerging mkts), TLT (Long Treasuries), VNQ (US real estate)

Equal-weight five-sleeve portfolio
rule              CAGR     Vol  Ret/Vol    MaxDD  Rebals  Turn/yr
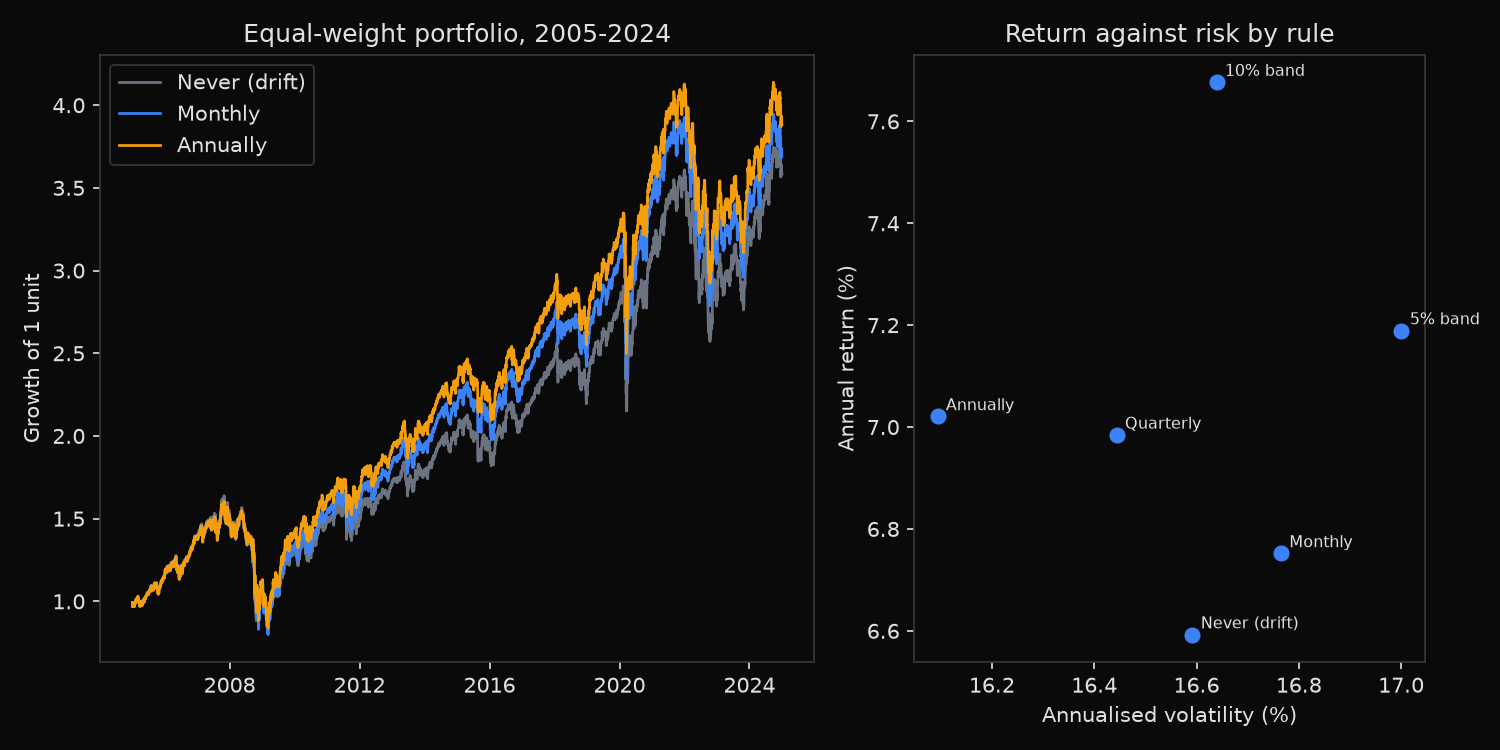
Never (drift)    6.59%  16.59%     0.40  -49.64%       0     0.0%
Monthly          6.75%  16.77%     0.40  -50.10%     240    14.4%
Quarterly        6.98%  16.44%     0.42  -48.97%      80     9.1%
Annually         7.02%  16.09%     0.44  -47.78%      20     4.8%
5% band          7.19%  17.00%     0.42  -49.19%      18     5.8%
10% band         7.68%  16.64%     0.46  -47.49%       7     4.0%

60/40 SPY/TLT
rule              CAGR     Vol  Ret/Vol    MaxDD  Rebals  Turn/yr
Never (drift)    8.37%  10.76%     0.78  -26.73%       0     0.0%
Monthly          7.96%  10.78%     0.74  -31.42%     240    13.1%
Quarterly        8.25%  10.66%     0.77  -30.14%      80     8.8%
Annually         8.28%  10.44%     0.79  -27.63%      20     4.5%
5% band          8.22%  11.05%     0.74  -31.10%      26     6.9%
10% band         8.20%  11.03%     0.74  -29.85%       6     3.1%

Drift portfolio final weights: SPY 39.5%, EFA 14.0%, EEM 15.5%, TLT 10.4%, VNQ 20.7%
Sleeve total returns: SPY 607%, EFA 150%, EEM 177%, TLT 86%, VNQ 271%

Five sleeves 2005-2014: Never (drift) 7.22%  Annually 8.78%  10% band 9.24%
Five sleeves 2015-2024: Never (drift) 5.96%  Annually 5.29%  10% band 5.48%
Monthly rule net of 1 bps per unit traded: 6.75% vs 6.59% for never rebalancing
Monthly rule net of 5 bps per unit traded: 6.74% vs 6.59% for never rebalancing
Monthly rule net of 10 bps per unit traded: 6.72% vs 6.59% for never rebalancing
What this tells us
Over the full twenty years the bonus looks real. Every rebalancing rule beat the drifting portfolio, by 0.43 percentage points a year for the annual rule and 1.09 for the 10% band, and the better rules delivered that while also running slightly lower volatility.
The sub-period split dismantles it. From 2005 to 2014 the annual rule beat drift by 1.56 points a year and the wide band by 2.02; from 2015 to 2024 both lost, by 0.67 and 0.48. The full-sample advantage is one decade of mean reversion around the financial crisis, when sleeves that collapsed together recovered together, followed by a decade in which US equity pulled away and selling it was a mistake.
The 60/40 portfolio shows the mechanism without needing a sub-period. US equity returned 607% against 86% for long Treasuries, so any rule that trimmed equity back to 60% gave up return, and every rule did: 8.37% for drift against 7.96% for monthly. Rebalancing is a bet that relative performance reverses, and when one sleeve simply wins for twenty years, the bet loses.
Frequency behaves the opposite way to what a harvesting story predicts. Trading more often should capture more mean reversion, yet monthly was the worst rebalancing rule in both portfolios, and the 10% band, which traded 7 times in twenty years, was the best of the five-sleeve set. Frequent rebalancing sells assets that are still rising and buys assets still falling, which is a short momentum position held on a calendar.
Costs do not decide this. Monthly rebalancing turned over 14.4% of the portfolio a year, so even at 10 basis points per unit traded the rule keeps 6.72% of its 6.75% gross.
What holds across both decades is the risk effect. Annual rebalancing cut volatility from 16.59% to 16.09% and the worst drawdown from 49.64% to 47.78%. More to the point, the drifting portfolio finished with 39.5% in US equity against the 20% it started with, and 10.4% in Treasuries.
So what?
Rebalance to control what the portfolio holds, not to earn a premium. The return effect changed sign between two consecutive decades in the same portfolio, which is the signature of a payoff that depends on relative performance reversing rather than on any mechanical harvest.
Prefer annual rebalancing or a wide threshold band to monthly. Both dominated the frequent rules here, both traded a fraction as often, and the wide band has the useful property of doing nothing at all in calm markets and acting decisively after a large move.
The strongest argument for rebalancing is in the final weights. An investor who chose an equal-weight portfolio in 2005 and left it alone was holding double the intended US equity exposure by 2024, having never made that decision. Whether the drift helped or hurt is beside the point: the portfolio being run was no longer the portfolio that was chosen. Set a schedule, write down the tolerance, and let the return consequences fall where they fall.
Built with xfinlink — free financial data API for Python. pip install -U xfinlink
pip install -U xfinlink