
Does High Profitability Persist? Five-Year Transition Analysis in Python
September 9, 2026
What’s the question?
Every valuation model extrapolates. A discounted cash flow model takes a company’s current margin and current growth rate and carries them forward, often for a decade, which is a bet on persistence.
There is no reason for profitability and growth to decay at the same speed. Competition erodes both, since high returns attract entrants and fast growth attracts capacity, but what protects a margin, such as a brand or the cost of switching supplier, is not what protects a growth rate.
Operating profitability here is operating income divided by total assets, measured before financing costs and tax, so borrowing cannot raise it. Growth is annualised revenue growth over the preceding three years.
The approach
The sample is the S&P 500 as it stood in each year, so companies later acquired or removed still count while they were members.
- For each formation year from 2008 to 2018, take the roster as at 1 January of the following year and carry every member by its permanent entity id, so a ticker later reassigned to another company cannot substitute one business for another.
- Pull annual revenue, operating income and total assets from 2004 onward, labelling each period by the calendar year it mostly covers, taken from the period end date. A year whose revenue falls below half of both neighbouring years, or whose operating income exceeds its revenue, is not a comparable twelve months of trading and leaves the sample.
- Rank each roster into five equal groups by operating profitability, and separately into five equal groups by three-year revenue growth.
- Find the same companies five fiscal years later, rank them again against that year’s roster, and record where each one landed.
- Pool the eleven formation years. The rosters hold 5,497 memberships; a company needs a comparable fiscal year at both ends of the window to contribute, leaving 4,547 pairs for profitability and 4,474 for growth.
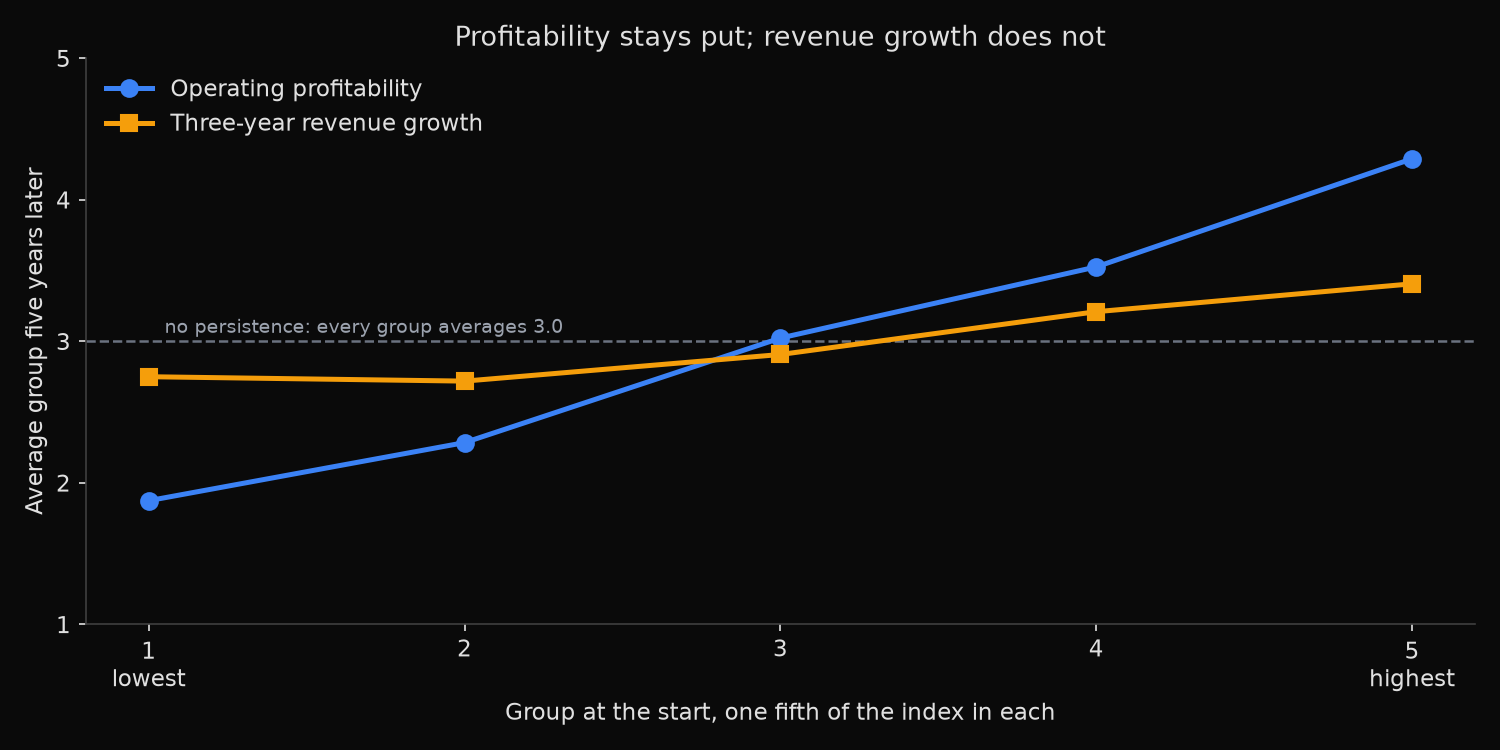
Were a characteristic to carry no information about the future, every starting group would average 3.0 five years later and 20 percent of each would land in the top fifth. Those are the benchmarks.
Code
import numpy as np
import pandas as pd
import xfinlink as xfl

xfl.set_api_key("YOUR_API_KEY")  # free at https://xfinlink.com/signup

rosters, ids = {}, set()
for y in range(2008, 2019):
    rosters[y] = set(xfl.index("sp500", as_of=f"{y + 1}-01-01")["entity_id"].dropna().astype(int))
    ids |= rosters[y]
ids = sorted(ids)

f = pd.concat([xfl.fundamentals(entity_id=ids[i:i + 50], period_type="annual",
                                start="2004-01-01", end="2024-12-31",
                                fields=["entity_id", "period_end", "revenue",
                                        "operating_income", "total_assets"])
               for i in range(0, len(ids), 50)], ignore_index=True)
f["period_end"] = pd.to_datetime(f["period_end"])
f["year"] = np.where(f["period_end"].dt.month <= 6,
                     f["period_end"].dt.year - 1, f["period_end"].dt.year)
f = f.sort_values(["entity_id", "year", "period_end"]).drop_duplicates(["entity_id", "year"], keep="last")

rev = f.pivot_table(index="entity_id", columns="year", values="revenue")
oi = f.pivot_table(index="entity_id", columns="year", values="operating_income").reindex_like(rev)
ta = f.pivot_table(index="entity_id", columns="year", values="total_assets").reindex_like(rev)

neighbour = np.minimum(rev.shift(1, axis=1), rev.shift(-1, axis=1))
drop = (rev <= 0) | ((rev < 0.5 * neighbour) & neighbour.notna()) | (oi > rev)
rev, oi = rev.mask(drop), oi.mask(drop)
usable = (rev > 0) & (ta > 0) & oi.notna()

prof = (oi / ta).where(usable)
growth = pd.DataFrame({y: ((rev[y] / rev[y - 3]) ** (1 / 3) - 1).where(usable[y] & (rev[y - 3] > 0))
                       for y in rev.columns if (y - 3) in rev.columns})

def cohorts(mat):
    out = []
    for y in range(2008, 2019):
        s = mat.loc[[i for i in rosters[y] if i in mat.index], [y, y + 5]].dropna()
        s.columns = ["x0", "x5"]
        s["q0"] = pd.qcut(s["x0"].rank(method="first"), 5, labels=[1, 2, 3, 4, 5]).astype(int)
        s["q5"] = pd.qcut(s["x5"].rank(method="first"), 5, labels=[1, 2, 3, 4, 5]).astype(int)
        out.append(s)
    return pd.concat(out)

for name, d in [("profitability", cohorts(prof)), ("growth", cohorts(growth))]:
    print(name, d.groupby("q0").agg(now=("x0", "mean"), later=("x5", "mean"), rank5=("q5", "mean")))
Full script with formatting and visualisation: does-high-profitability-persist-python.py
Output
Formation years 2008-2018, horizon +5 fiscal years
Company-years: 4,547 profitability, 4,474 revenue growth
Companies: 603 profitability, 598 growth

OPERATING PROFITABILITY  (operating income / total assets)
 quintile      n  at formation  5 years on  mean quintile  stays top  falls bottom
        1    914         0.6%        3.7%           1.87       4.4%         50.5%
        2    907         5.8%        5.1%           2.28       2.5%         21.2%
        3    907         9.1%        8.0%           3.02       9.6%         13.6%
        4    907        13.2%       10.2%           3.53      21.6%          9.5%
        5    912        22.7%       17.3%           4.29      62.1%          5.6%
  top-minus-bottom spread 22.1% at formation, 13.6% five years on (61% retained)
  rank correlation across five years: 0.616 pooled, 0.622 average by cohort (range 0.561 to 0.702)

THREE-YEAR REVENUE GROWTH  (annualised)
 quintile      n  at formation  5 years on  mean quintile  stays top  falls bottom
        1    900        -8.4%        2.9%           2.75      16.9%         28.1%
        2    893         0.7%        2.8%           2.72      11.2%         20.3%
        3    892         4.4%        3.4%           2.91      14.5%         18.7%
        4    893         8.6%        5.5%           3.21      21.8%         15.8%
        5    896        22.6%        7.6%           3.41      35.7%         17.6%
  top-minus-bottom spread 31.1% at formation, 4.7% five years on (15% retained)
  rank correlation across five years: 0.189 pooled, 0.185 average by cohort (range 0.051 to 0.282)
What this tells us
The two characteristics behave nothing alike. Of the companies in the most profitable fifth of the index, 62.1 percent are still in the most profitable fifth five years later, three times what a coin flip would produce, and 5.6 percent fall to the bottom fifth. The bottom group is almost as sticky in the other direction, with 50.5 percent of it still at the bottom. A rank correlation of 0.616 across a five-year gap is high for any cross-section of large companies, and all eleven cohorts land between 0.561 and 0.702.
Growth is close to the opposite. The fastest-growing fifth compounded revenue at 22.6 percent a year going in and at 7.6 percent over the following five, and 35.7 percent of it stayed in the top group. The slowest fifth was shrinking at 8.4 percent a year and afterwards grew at 2.9 percent, ahead of the second group and a shade behind the third. The spread tells it more bluntly: the gap between fastest and slowest starts at 31.1 percentage points and is 4.7 points five years later, so 85 percent of it is gone.
Levels drift down on both measures. The most profitable fifth gives back a quarter of its profitability, 22.7 percent to 17.3 percent, while the least profitable improves from 0.6 percent to 3.7 percent. The difference is degree: profitability converges slowly and incompletely, growth almost entirely inside five years. One feature of the construction cuts a known way, since a company needs a comparable fiscal year at both ends to appear and failure is commoner at the bottom, which flatters profitability persistence a little.
So what?
The consequence lands in the assumptions of a forecast model. Fading a high margin toward an industry average over ten years is roughly consistent with this evidence; fading a high growth rate over ten years is not, because most of the fade has happened by year five.
The same asymmetry decides what a screen is worth. Selecting on high profitability selects a characteristic that mostly survives the holding period, one reason quality factors built on operating profitability hold up out of sample. Selecting on high past growth mostly selects companies that have already grown, and two thirds of them have left the fast-growing group within five years. Use the table as a prior: five years on, the fastest growers of today average 7.6 percent against the slowest at 2.9 percent, a gap of 4.7 points where their track records advertise 31.1.
pip install -U xfinlink