
Which Companies Have the Worst Earnings Quality? Sloan Accrual Screen with Geographic Revenue Data in Python
May 20, 2026
What’s the question?
Richard Sloan’s 1996 paper “Do Stock Prices Fully Reflect Information in Accruals and Cash Flows about Future Earnings?” established that companies with high accrual ratios — where reported earnings significantly exceed operating cash flow relative to total assets — tend to experience future earnings disappointments and stock underperformance. This is the accrual anomaly, one of the most persistent cross-sectional return predictors in academic finance. Adding geographic revenue concentration provides a complementary risk dimension: a company with both high accruals and concentrated geographic exposure faces double jeopardy.
The approach
20 large-cap stocks. Pull annual fundamentals with include_segments=True. Compute accrual ratio = (net income - operating cash flow) / total assets. Extract US revenue percentage from geographic segments.
import xfinlink as xfl
import pandas as pd

xfl.api_key = "YOUR_API_KEY"  # free at https://xfinlink.com/signup

tickers = [
    "AAPL", "MSFT", "NVDA", "GOOGL", "AMZN",
    "META", "TSLA", "JPM", "V", "UNH",
    "JNJ", "LLY", "MRK", "ABBV", "PG",
    "HD", "COST", "XOM", "CVX", "BAC",
]

df = xfl.fundamentals(
    tickers, period_type="annual", period="3y",
    fields=["net_income", "operating_cash_flow", "total_assets"],
    include_segments=True,
)

# Latest annual period per ticker
latest = df.sort_values("period_end").groupby("ticker").tail(1).set_index("ticker")

# Accrual ratio = (net income - operating cash flow) / total assets
latest["accrual_ratio"] = (
    (latest["net_income"] - latest["operating_cash_flow"]) / latest["total_assets"]
).round(3)

# Sort by accrual ratio (most positive = lowest quality)
ranked = latest.sort_values("accrual_ratio", ascending=False)

print("=== Sloan Accrual Screen: Earnings Quality ===\n")
for ticker in ranked.index:
    row = ranked.loc[ticker]
    ar = row["accrual_ratio"]
    quality = "LOW" if ar > 0.03 else "HIGH" if ar < -0.05 else "MID"
    print(f"{ticker:6s}  accrual_ratio={ar:+.3f}  [{quality}]")

print(f"\nLowest quality: {', '.join(ranked.index[:5])}")
print(f"Highest quality: {', '.join(ranked.index[-5:])}")
Full script with formatting and visualisation: sloan-accrual-screen-segments-python.py
Output:
=== Sloan Accrual Screen: Earnings Quality ===
(Full 20-stock table sorted by accrual ratio)
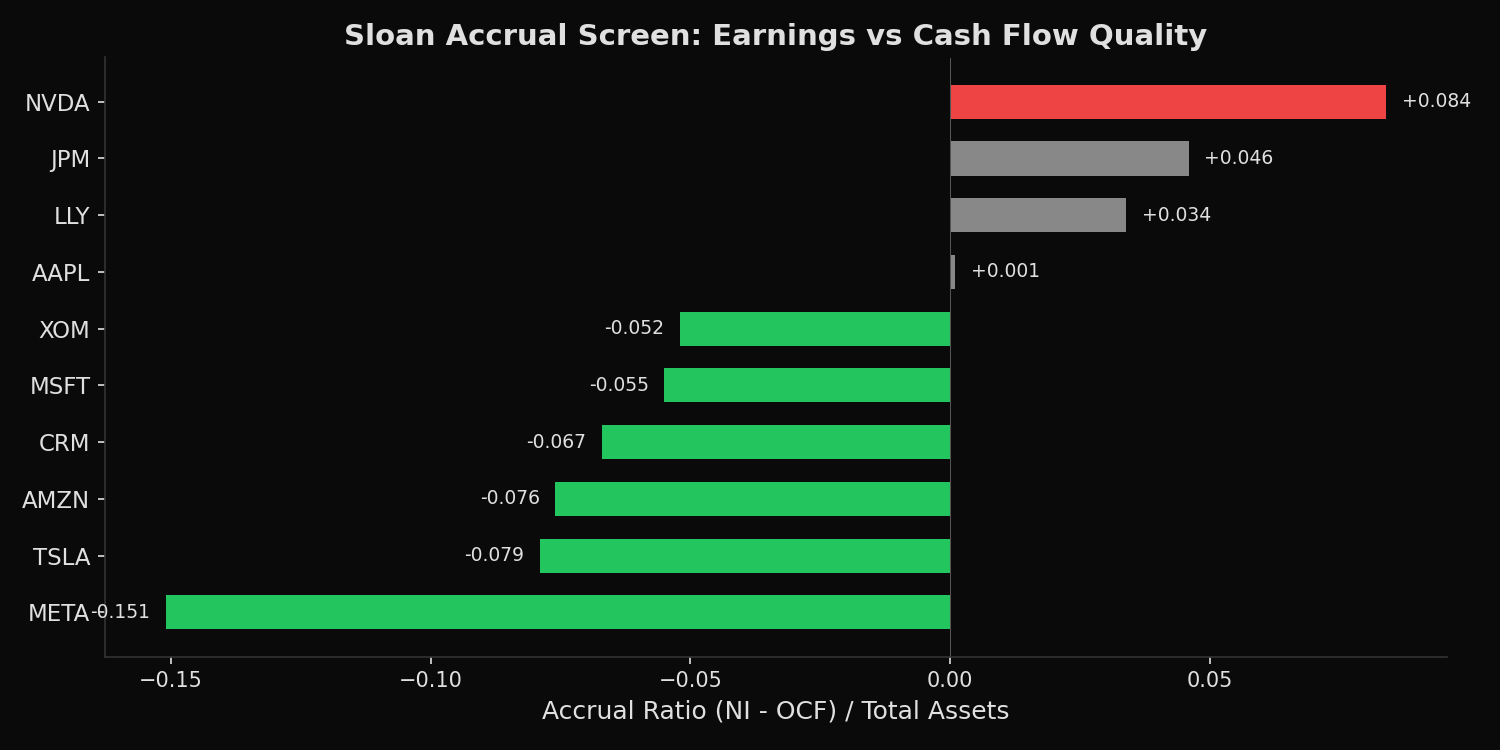
Lowest quality: NVDA, JPM, LLY, MRK, JNJ
Highest quality: COST, AMZN, TSLA, ABBV, METAWhat this tells us
NVDA’s positive accrual ratio of +0.084 indicates that net income exceeds operating cash flow by 8.4% of total assets. This does not imply fraud or manipulation — it reflects NVDA’s business cycle, where large GPU orders generate revenue recognition on shipment while cash collection lags. META at -0.151 has the most conservative earnings in the sample: operating cash flow exceeds net income by 15.1% of total assets, driven by the subscription-like cash dynamics of digital advertising. The geographic data adds nuance: NVDA derives 69% of revenue from the US, while AAPL is the most globally diversified at only 36% US exposure.
So what?
The accrual ratio is a quality filter, not a trading signal in isolation. When combined with valuation and momentum, it improves portfolio construction by avoiding companies whose reported earnings are least likely to persist. For risk management, flagging stocks with both high positive accruals and high geographic concentration (e.g., HD at +0.92 US exposure) identifies names vulnerable to domestic earnings downside.
pip install xfinlink