
What’s the question?
The price-to-sales ratio is a blunt instrument. A company valued at ten times sales looks expensive beside one at two times sales, but the comparison means little if the first keeps forty cents of every sales dollar as operating profit and the second keeps four. Sales are not what an investor is buying. The profit those sales throw off is.
Enterprise value to sales corrects part of the problem on the value side. Enterprise value is the whole company, equity plus net debt, so the ratio measures what it costs to buy the entire business against the revenue that business produces. The multiple should rise with margin, because a company that converts more of each revenue dollar into profit is worth more per dollar of revenue. That is the theory.
The question is whether the market prices it that way in practice, and how much of the spread in sales multiples across large companies margin alone can account for.
The approach
The sample is 35 large companies from outside finance and real estate. A sales multiple does not describe a bank, and enterprise value behaves strangely for a business whose debt is its raw material, so those sectors are set aside.
For each company the analysis takes the operating margin and the enterprise-value-to-sales ratio from its most recent completed fiscal year, then measures the relationship two ways: the correlation between the two, and a straight-line regression of EV/Sales on margin. Companies without both figures for that year drop from the cross-section. The regression line is not a valuation model. It is a summary of how the market has actually paid for margin across this group.
Code
import numpy as np
import xfinlink as xfl

xfl.set_api_key("YOUR_API_KEY")  # free at https://xfinlink.com/signup

tickers = ["AAPL", "MSFT", "NVDA", "GOOGL", "AMZN", "META", "AVGO", "ORCL",
           "ADBE", "CRM", "CSCO", "TXN", "QCOM", "AMD", "INTC", "JNJ", "UNH",
           "LLY", "MRK", "ABBV", "PFE", "TMO", "ABT", "DHR", "PG", "KO", "PEP",
           "COST", "WMT", "MCD", "NKE", "SBUX", "XOM", "CVX", "CAT", "HON",
           "DE", "LIN"]

m = xfl.metrics(tickers, period_type="annual", period="2y",
                fields=["operating_margin", "ev_revenue"])

latest = m.sort_values("period_end").groupby("ticker", as_index=False).last()
d = latest.dropna(subset=["operating_margin", "ev_revenue"]).copy()
d["op_margin"] = d["operating_margin"] * 100

r = np.corrcoef(d["op_margin"], d["ev_revenue"])[0, 1]
slope, intercept = np.polyfit(d["op_margin"], d["ev_revenue"], 1)
print(r, r**2, slope, intercept)
Full script with formatting and visualisation: profit-margin-valuation-premium-python.py
Output
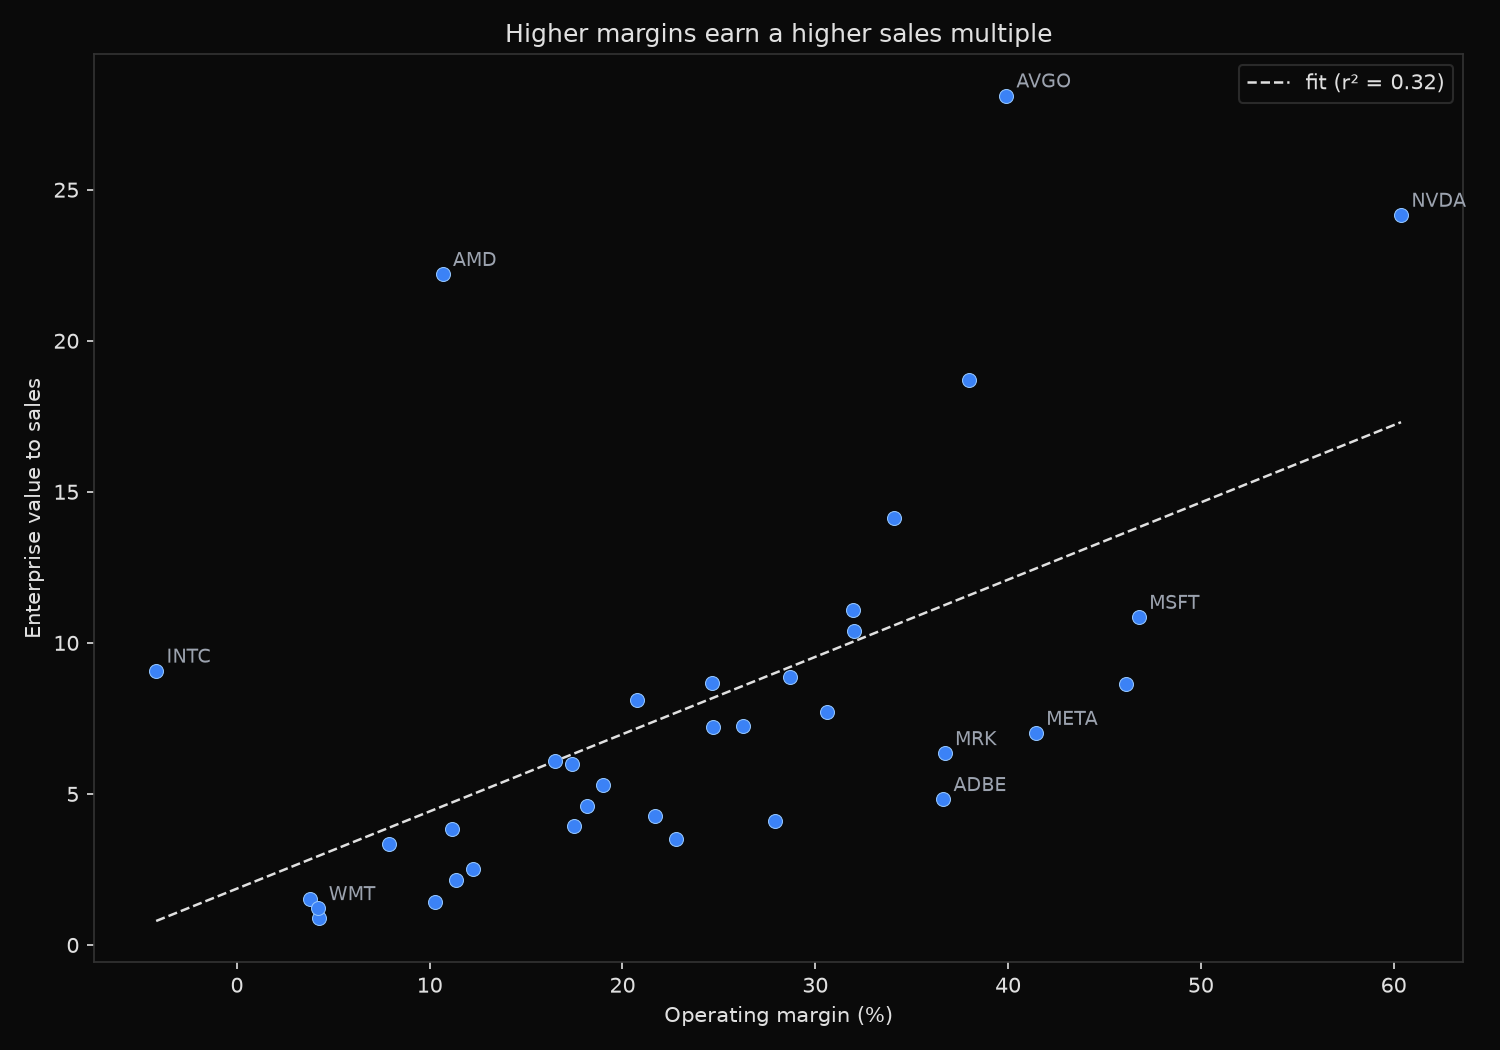
35 companies
correlation of operating margin with EV/Sales: 0.565  (r^2 = 0.319)
regression: EV/Sales = 1.87 + 0.256 x operating margin(%)

ticker  op_margin  ev_revenue
  INTC      -4.19        9.07
  COST       3.77        1.52
   WMT       4.22        1.21
   UNH       4.24        0.91
  SBUX       7.90        3.35
   CVX      10.29        1.41
   AMD      10.66       22.20
  AMZN      11.16        3.84
   XOM      11.34        2.16
   PEP      12.24        2.51
   CAT      16.50        6.09
   TMO      17.38        5.98
    DE      17.48        3.95
   ABT      18.17        4.60
   CRM      19.01        5.30
  CSCO      20.76        8.11
   HON      21.71        4.26
   PFE      22.76        3.52
  ABBV      24.65        8.67
   JNJ      24.71        7.21
   LIN      26.25        7.24
  QCOM      27.90        4.11
    KO      28.71        8.87
  ORCL      30.59        7.72
  AAPL      31.97       11.10
 GOOGL      32.03       10.39
   TXN      34.06       14.15
  ADBE      36.63        4.82
   MRK      36.71        6.34
   LLY      38.00       18.69
  AVGO      39.89       28.11
  META      41.44        7.01
   MCD      46.10        8.65
  MSFT      46.78       10.85
  NVDA      60.38       24.16
What this tells us
Margin and valuation move together, and the link is strong enough to take seriously: the correlation is 0.565, and margin accounts for about a third of the variation in sales multiples across the group (r-squared of 0.319, significant well beyond the one-percent level). The slope says each extra percentage point of operating margin is worth roughly a quarter-turn of EV/Sales. Nvidia and Microsoft, near the top on margin, sit near the top on multiple. Walmart and Costco, running on retail margins near four percent, sit at the bottom on both.
The two-thirds the line does not explain is where the useful information hides. Intel trades at nine times sales on a negative operating margin, which no margin-based model can justify: the market is paying for factories and an expected turnaround, not for current profit. AMD sits at 22 times sales on an 11 percent margin, priced for growth that its present margin does not show. Adobe is the mirror image, a 37 percent margin near the top of the sample paired with a sales multiple below five, well under the fitted line, because the market is discounting its growth outlook rather than its profitability.
So what?
A sales multiple should never be read without the margin beside it. A low EV/Sales is not cheap if the margin is thin, and a high one is not expensive if the margin is fat. The regression gives a rough fair-multiple line: put in a company’s margin, and the fitted EV/Sales is what a market that priced margin and nothing else would pay.
Distance from that line is the signal, not the multiple itself. A stock far above the fit is being priced for something margin does not capture, usually growth or scarcity value; a stock far below is being marked down for a risk its current profitability does not reveal. Neither position is automatically wrong. The line only tells an analyst which question to ask about a given name.
For a screen, the residual from this margin line is a cleaner value measure than raw EV/Sales, because it judges each company against what its own profitability justifies rather than against a blended average that lumps software in with supermarkets. Build the line from a relevant peer set, rank by distance below it, and the result is a list of companies that look cheap relative to how profitable they actually are.
Built with xfinlink — free financial data API for Python.