
What’s the question?
Almost every published equity backtest re-forms its portfolio at the end of the month. The convention comes from data availability rather than theory: monthly return files were what researchers had, so month end became the rebalance date and stopped being questioned.
Nothing about a signal points to the 31st. A momentum ranking computed on the 30th and one computed on the 7th sort nearly the same companies on nearly the same information, so a strategy with a real edge should be close to indifferent between them. Where it is not, part of the reported performance belongs to the calendar.
Run the same strategy 21 times changing only the rebalance day: the width of the resulting distribution is the luck. If that width matches the edge being claimed, a single-date result is one draw rather than an answer.
The approach
The test signal is 12-1 cross-sectional momentum: rank every index member on its total return over the twelve months ending one month ago, buy the top decile, sell the bottom decile, and hold to the next rebalance. Once the window is fixed, nothing is left to tune.
Offsets are counted in trading days back from each calendar month end. Offset 0 is the last trading day of the month, offset 20 around the 3rd. Counting this way keeps the number of rebalances and the length of every holding period identical across the 21 runs, so only the phase within the month changes. In a 19-day month offset 20 reaches into the previous month, which happens 44 times in 127.
- Pull S&P 500 membership at each month end from November 2014 to July 2026, carrying every company by entity identifier rather than by ticker, so a recycled symbol cannot splice one company’s prices onto another’s. The roster used is the most recent one strictly before the rebalance date, which removes survivorship bias.
- Pull daily closes and daily total returns for the 730 companies appearing in any roster and compound every period aggregate from those dailies. Where period boundaries fall is the entire question here.
- Screen the panel: duplicate rows and non-positive prices go, and a name whose daily total return ever doubles or halves is set aside rather than winsorised. Names without a usable daily series drop from the sample.
- Run the identical backtest 21 times over that panel in memory, changing only the offset. A name is ranked only if it holds an unbroken daily series across its formation window and its holding month.
Sharpe is mean return over volatility, no risk-free deduction.
Code
import numpy as np
import pandas as pd
import xfinlink as xfl
from concurrent.futures import ThreadPoolExecutor

xfl.set_api_key("YOUR_API_KEY")  # free at https://xfinlink.com/signup

SNAPSHOTS = pd.date_range("2014-11-30", "2026-07-31", freq="ME").strftime("%Y-%m-%d").tolist()
ANCHORS = [s for s in SNAPSHOTS if s >= "2016-01-01"]
FORM, SKIP, OFFSETS = 252, 21, 21

with ThreadPoolExecutor(8) as pool:
    rosters = dict(zip(SNAPSHOTS, pool.map(
        lambda d: sorted(int(e) for e in xfl.index("sp500", as_of=d)["entity_id"].dropna()),
        SNAPSHOTS)))
universe = sorted({e for ids in rosters.values() for e in ids})

with ThreadPoolExecutor(8) as pool:
    px = pd.concat([d for d in pool.map(
        lambda e: xfl.prices(entity_id=e, start="2014-11-01", end="2026-07-31",
                             fields=["close", "return_daily"], max_rows=200000),
        universe) if len(d)], ignore_index=True)

px = px.drop_duplicates(["entity_id", "date"])
px = px[px["close"] > 0]
R = px.pivot(index="date", columns="entity_id", values="return_daily").sort_index()
R = R[[c for c in R.columns if not ((R[c] > 1.0).any() or (R[c] < -0.5).any())]]

cal = R.index
logret = np.log1p(R.fillna(0.0)).cumsum().values   # cumulative log total return
live = R.notna().cumsum().values                   # cumulative count of traded days
pos = {e: i for i, e in enumerate(R.columns)}
snaps = pd.to_datetime(SNAPSHOTS)
month_end = pd.Series(np.arange(len(cal))).groupby(np.asarray(cal.year * 100 + cal.month)).max()


def backtest(offset):
    """Re-form the deciles 'offset' trading days before each calendar month end."""
    days = [int(month_end[int(a[:4]) * 100 + int(a[5:7])]) - offset for a in ANCHORS]
    spread = []
    for t, nxt in zip(days, days[1:]):
        members = rosters[SNAPSHOTS[snaps.searchsorted(cal[t], "left") - 1]]
        ids = np.array([pos[e] for e in members if e in pos])
        usable = ((live[t - SKIP, ids] - live[t - FORM, ids] == FORM - SKIP)
                  & (live[nxt, ids] - live[t, ids] == nxt - t))
        ids = ids[usable]
        signal = logret[t - SKIP, ids] - logret[t - FORM, ids]   # months t-12 to t-1
        held = np.expm1(logret[nxt, ids] - logret[t, ids])       # the month held
        rank = np.argsort(np.argsort(signal, kind="stable"), kind="stable")
        decile = rank * 10 // len(ids)
        spread.append(held[decile == 9].mean() - held[decile == 0].mean())
    return np.array(spread)


runs = {k: backtest(k) for k in range(OFFSETS)}
for k, s in runs.items():
    print(f"offset {k:2d}  {np.prod(1 + s) ** (12 / len(s)) - 1:7.2%} a year  "
          f"Sharpe {s.mean() / s.std(ddof=1) * np.sqrt(12):6.2f}")
Full script with formatting and visualisation: rebalance-date-luck-backtest-python.py
Output
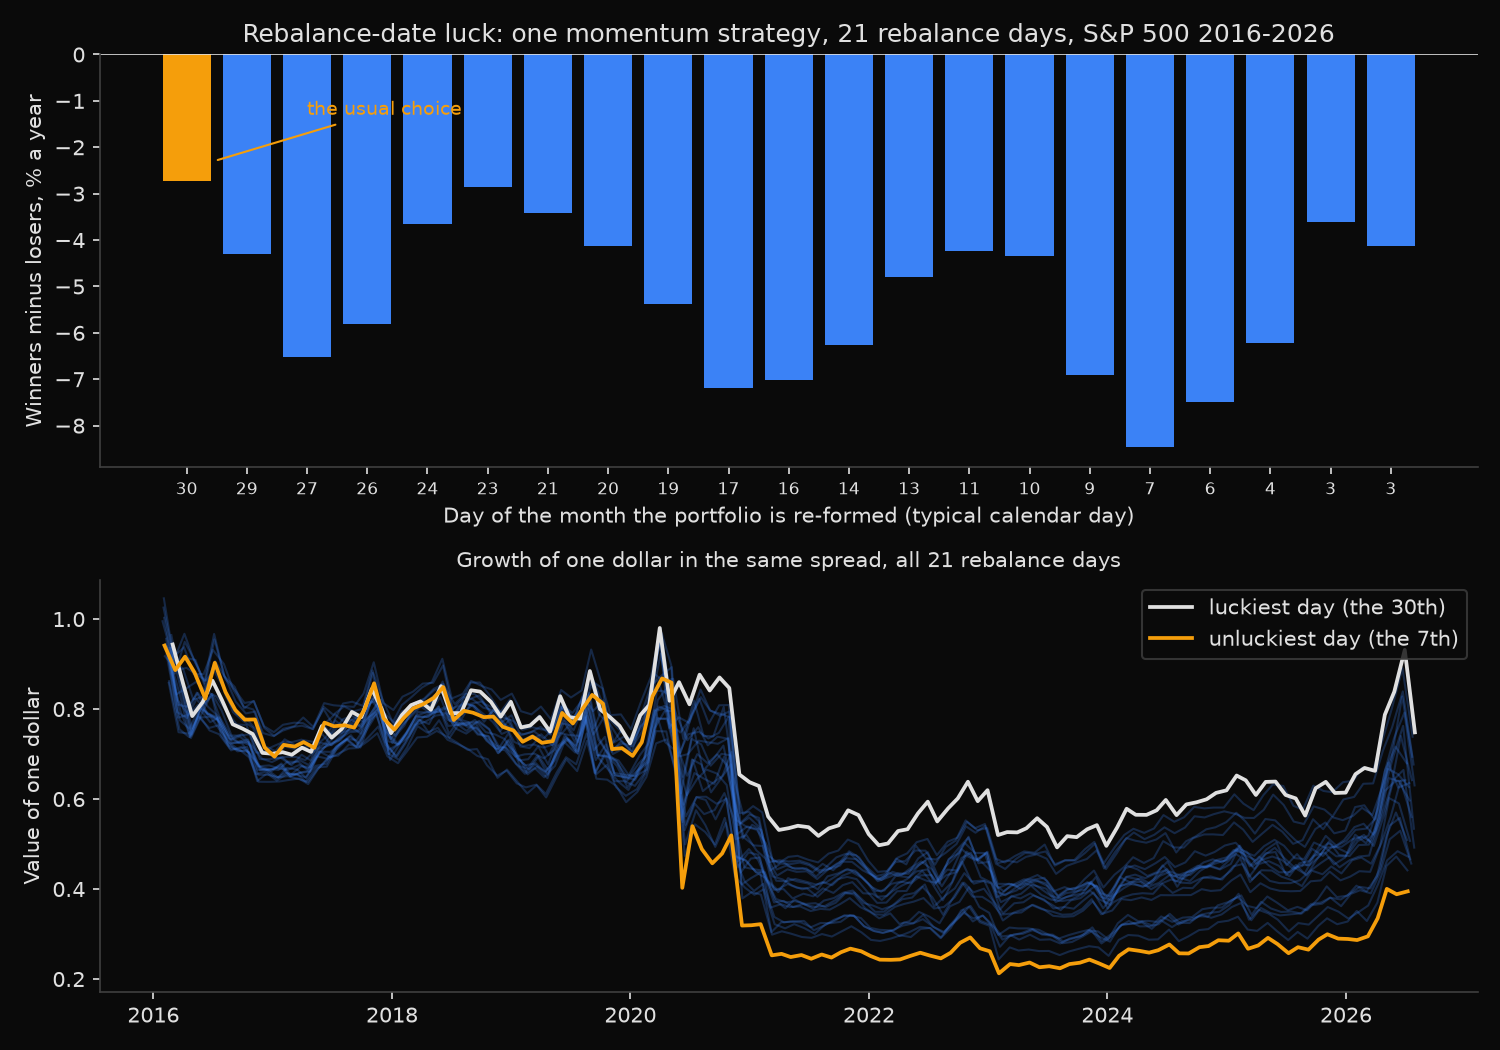
Rebalance-date sensitivity of a 12-1 momentum decile sort, point-in-time S&P 500
Panel: 141 month-end rosters covering 730 companies; 723 carry a daily series for the window and 23 are set aside
       by the return screen, leaving 700 names and 1,801,128 daily observations
Runs:  21 rebalance offsets, each with 127 rebalance dates and 126 holding periods, 2016-01 to 2026-07
Offset k re-forms the deciles k trading days before the calendar month end (k=0 is month end)

Offset  Typical  Names   Winners   Losers   Long-short   Ann vol  Sharpe      t
 (days)   day    ranked   a year   a year       a year
    0       30     483   14.89%   12.63%       -2.72%    22.64%   -0.01  -0.02
    1       29     483   14.82%   13.93%       -4.30%    24.28%   -0.05  -0.17
    2       27     483   13.21%   14.17%       -6.53%    25.61%   -0.12  -0.39
    3       26     483   13.98%   14.30%       -5.80%    26.08%   -0.08  -0.27
    4       24     483   15.07%   14.12%       -3.65%    22.10%   -0.05  -0.17
    5       23     483   14.83%   13.44%       -2.85%    20.52%   -0.04  -0.12
    6       21     483   14.83%   13.89%       -3.42%    21.10%   -0.06  -0.19
    7       20     483   13.92%   14.05%       -4.13%    20.86%   -0.10  -0.31
    8       19     483   14.22%   15.69%       -5.37%    20.93%   -0.16  -0.51
    9       17     483   13.60%   16.01%       -7.19%    23.00%   -0.20  -0.66
   10       16     483   14.05%   15.98%       -7.01%    24.12%   -0.17  -0.56
   11       14     483   14.53%   15.80%       -6.26%    23.25%   -0.15  -0.50
   12       13     483   14.39%   14.84%       -4.80%    22.39%   -0.10  -0.34
   13       11     484   14.71%   14.97%       -4.23%    21.17%   -0.10  -0.31
   14       10     484   14.77%   15.00%       -4.35%    21.74%   -0.09  -0.30
   15        9     484   14.56%   14.24%       -6.90%    28.46%   -0.08  -0.27
   16        7     484   13.94%   14.05%       -8.47%    30.42%   -0.11  -0.35
   17        6     484   13.42%   13.58%       -7.49%    29.82%   -0.09  -0.30
   18        4     484   13.94%   14.11%       -6.23%    26.30%   -0.10  -0.33
   19        3     484   14.44%   13.02%       -3.61%    23.21%   -0.04  -0.12
   20        3     483   14.33%   13.44%       -4.14%    22.67%   -0.07  -0.22

Spread of outcomes across the 21 rebalance offsets
  Long-short a year        best   -2.72%  (offset 0, around the 30th)
                           worst  -8.47%  (offset 16, around the 7th)
                           gap     5.74% a year, standard deviation 1.66%
  Winners leg a year        13.21% to 15.07%, gap 1.85%
  Losers leg a year         12.63% to 16.01%, gap 3.38%
  Sharpe                     -0.20 to -0.01
  t-statistic                -0.66 to -0.02
  One dollar becomes          0.75 at the best offset against 0.39 at the worst
  The 2021-2026 half alone   0.12% to 6.01%, gap 5.90%

  Typical gap between the best and worst offset in one month  11.41%
  Sampling error of the month-end run alone, annualised   6.99%
  Mean pairwise correlation of the 21 monthly spreads     0.580
  Winner decile shared, month-end sort against mid-month  79.6%
What this tells us
The 21 runs rank almost the same companies and land 5.74 percentage points a year apart. Month end returns −2.72% a year and the 7th returns −8.47%, while the winner deciles picked at month end and in the middle of the month share 79.6% of their names. This is one portfolio, priced on different days.
Both legs move. The winners leg ranges from 13.21% to 15.07% a year and the losers leg from 12.63% to 16.01%; one dollar in the spread ends at 0.75 at the luckiest offset against 0.39 at the unluckiest. Inside a single holding month the best and worst offsets typically differ by 11.41 points.
The standard error of the month-end run’s own annualised mean is 6.99 points, so the spread across rebalance days is four fifths of one standard error. The recent half of the sample shows the cost: over holding periods ending 2021 onward every offset turns positive, yet the range runs from 0.12% to 6.01% a year. Same signal, same universe, same code, same 126 months.
The shape across offsets is not flat, month end and the turn of the month being strongest, but with 21 runs sharing 126 months and correlating at 0.580 one decade cannot separate a turn-of-the-month tilt from noise.
So what?
Sweep the offset before believing a monthly backtest. One price panel and 21 in-memory passes turn a single number into a distribution: the range, and where the conventional month-end figure sits inside it. A result that holds at one offset and vanishes at the other twenty is not a result.
Check the direction of the flattery. Month end produced the best of the 21 outcomes here, and month end is what the convention picks; a strategy strongest on exactly the conventional date deserves more scepticism than its Sharpe invites.
The live remedy is mechanical: split the rebalance into tranches, a fifth of the book on each of five consecutive days, and the portfolio earns close to the average of this distribution rather than one draw from it. At 5.74 points a year against a claimed edge smaller than itself, the calendar is otherwise making the larger decision.
Built with xfinlink — free financial data API for Python.