Does AI Stock Leadership Persist? Momentum Backtest in Python
June 17, 2026
What's the question?
AI leadership rotates. At different points, the market rewards semiconductors, cloud platforms, software names, or server manufacturers. A concentrated AI portfolio that holds yesterday's leaders may capture the theme, but it may also become stale if leadership changes.
Momentum provides a disciplined way to test persistence. The rule is simple: stocks with the strongest recent returns are assumed to have a higher probability of leading in the next period. The test does not explain why the leadership exists. It asks whether recent leadership has been useful enough to allocate capital.
The question is whether a simple AI momentum strategy outperforms an equal-weight basket of the same stocks after accounting for volatility and drawdown.
The approach
The universe is NVDA, AVGO, AMD, MSFT, META, AMZN, GOOG, ORCL, PLTR, and SMCI. Built from SEC EDGAR public filings and market data, the backtest uses split-adjusted daily prices and converts them to complete monthly observations.
- Pull three years of adjusted daily prices
- Convert prices to month-end observations and exclude incomplete months
- At each monthly rebalance, rank stocks by prior three-month return
- Hold the top three names equal-weighted for the next month
- Compare the strategy with an equal-weight AI basket
The signal is shifted by one month. This prevents the backtest from using the return being measured as part of the ranking signal.
Code
import xfinlink as xfl
import pandas as pd

xfl.set_api_key("YOUR_API_KEY")  # free at https://xfinlink.com/signup

tickers = ["NVDA", "AVGO", "AMD", "MSFT", "META", "AMZN", "GOOG", "ORCL", "PLTR", "SMCI"]
prices = xfl.prices(tickers, period="3y", fields=["adj_close"])
daily = prices.pivot_table(index="date", columns="ticker", values="adj_close").dropna()
monthly = daily.resample("ME").last()

monthly_returns = monthly.pct_change().dropna()
signal = monthly.pct_change(3).shift(1)

top3_returns = []
for dt in signal.dropna().index.intersection(monthly_returns.index):
    leaders = signal.loc[dt].sort_values(ascending=False).head(3).index
    top3_returns.append(monthly_returns.loc[dt, leaders].mean())

top3 = pd.Series(top3_returns, index=signal.dropna().index.intersection(monthly_returns.index))
equal_weight = monthly_returns.loc[top3.index].mean(axis=1)

print((1 + top3).prod(), (1 + equal_weight).prod())
Full script with formatting and visualisation: ai-momentum-leadership-backtest-python.py
Output
=== AI Momentum Leadership Backtest ===
Universe: 10 AI-linked stocks
Sample: 2023-10-31 to 2026-05-31 (32 monthly rebalances)
Signal: prior 3-month return; portfolio: top 3 equal-weighted names
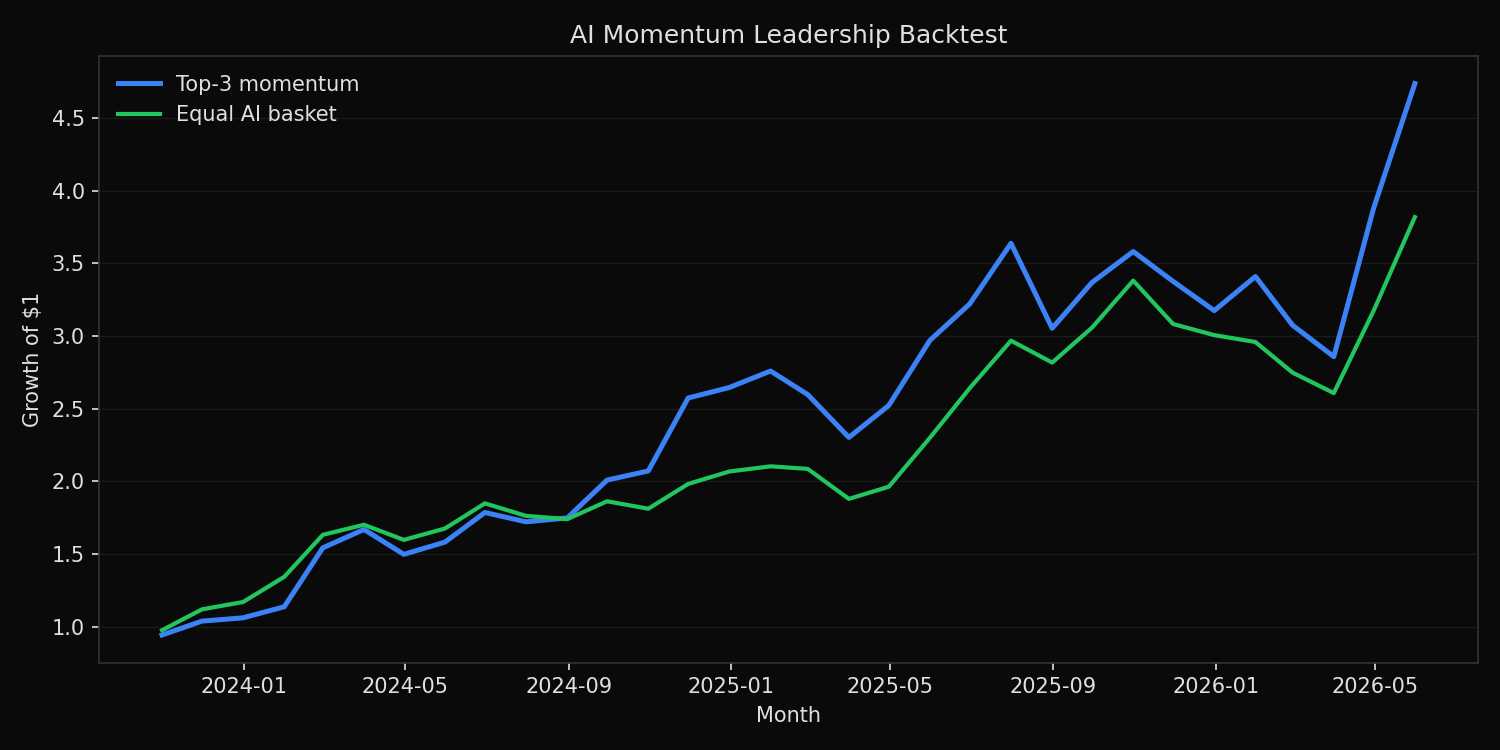
Portfolio comparison:
Top-3 momentum return=+79.2% vol=43.6% max_drawdown=-21.4% positive_months=68.8%
Equal AI basket return=+65.3% vol=32.0% max_drawdown=-22.9% positive_months=59.4%
Most frequent momentum leaders:
PLTR selected in 15 months
AMD selected in 11 months
AVGO selected in 11 months
GOOG selected in 10 months
NVDA selected in 10 months
ORCL selected in 10 months
SMCI selected in 9 months
META selected in 8 months
AMZN selected in 8 months
MSFT selected in 4 months
Latest signal leaders:
AMD trailing_3m_return=+42.4%
AVGO trailing_3m_return=+22.4%
AMZN trailing_3m_return= +9.9%What this tells us
Momentum worked in this AI universe over the sample. The top-three momentum strategy produced a 79.2% annualized return versus 65.3% for the equal-weight basket. It also had a slightly smaller maximum drawdown, -21.4% versus -22.9%.
The improvement did not come for free. Volatility rose from 32.0% to 43.6%. The strategy was more concentrated, so it captured upside from leaders but accepted larger month-to-month swings. That is the usual tradeoff in a leadership strategy.
The leader counts show that the AI trade was not only one stock. PLTR was selected in 15 months, but AMD, AVGO, GOOG, NVDA, ORCL, SMCI, META, and AMZN all appeared repeatedly. Leadership persistence existed, but it rotated across hardware, platforms, and software.
So what?
Momentum is useful when the goal is to stay aligned with the current AI leadership rather than hold a fixed thematic basket. It can improve returns during a strong trend, but the higher volatility means it should be paired with risk limits.
The practical rule is to separate signal strength from position size. A top-three momentum ranking can identify leaders, but the portfolio does not have to allocate equally to high-volatility names. Volatility caps, maximum position limits, or drawdown stops can keep the signal useful without allowing the strongest narrative stocks to dominate total risk.
Built with xfinlink — free financial data API for Python. pip install -U xfinlink
pip install -U xfinlink