
What’s the question?
An index return is an average, and averages conceal the shape of what they average. The S&P 500 returned 175% in price terms over the eight years to June 2026, which invites the inference that a typical member roughly tripled. That inference is wrong, and the size of the error decides whether stock picking inside the index is worth attempting.
Skewness is the reason. Equity returns are bounded below at minus one hundred per cent and unbounded above, so a small number of very large winners can carry an index while most of its members do worse than the average they belong to. Hendrik Bessembinder documented the extreme form of this in 2018, finding that most individual US stocks failed to beat Treasury bills over their lifetimes. The question here is narrower: what share of S&P 500 members beat the index they sit in?
Answering it requires a point-in-time roster, the list of members as they stood on a past date, including companies later removed. A universe built from today’s membership would select on the outcome and delete the failures. A cross-sectional dispersion study puts a number on how far apart members finish in a given year.
The approach
The test runs on two horizons, because a one-year answer and an eight-year answer are not the same question. Returns are price returns throughout, dividends excluded on the stocks and the benchmark alike.
- Pull the S&P 500 roster as of 30 June for each year from 2018 to 2025 with the
as_ofparameter, which returns membership as it stood on that date - Pull monthly split-adjusted closes for every company appearing in any roster, plus SPY as the benchmark
- Collapse the history to one observation per company per calendar month, keeping the last bar in each month
- At each formation date, measure the twelve-month price return of every member and count how many exceeded the benchmark
- Repeat once over the full eight years, holding the June 2018 roster without rebalancing
The eight-year measurement needs a continuous monthly series to June 2026, which 428 of the June 2018 members carry; companies acquired or no longer trading during the window drop from that sample. That filter runs against the finding rather than toward it, since removing the companies that disappeared can only flatter those that remain.
Code
import pandas as pd
import xfinlink as xfl

xfl.set_api_key("YOUR_API_KEY")  # free at https://xfinlink.com/signup

rosters = {y: xfl.index("sp500", as_of=f"{y}-06-30").dropna(subset=["ticker"])
           for y in range(2018, 2026)}
universe = sorted({t for r in rosters.values() for t in r["ticker"]})

frames = [xfl.prices(universe[i:i + 100], start="2017-12-01", end="2026-08-19",
                     interval="1mo", fields=["adj_close"], max_rows=500000)
          for i in range(0, len(universe), 100)]
px = pd.concat(frames, ignore_index=True)
spy = xfl.prices(["SPY"], start="2017-12-01", end="2026-08-19",
                 interval="1mo", fields=["adj_close"])


def month_end_panel(df):
    df = df.copy()
    df["date"] = pd.to_datetime(df["date"])
    df["month"] = df["date"].dt.to_period("M")
    df = df.sort_values("date").groupby(["entity_id", "month"], as_index=False).last()
    return df.pivot(index="month", columns="entity_id", values="adj_close")


panel, bench = month_end_panel(px), month_end_panel(spy).iloc[:, 0]

for year in range(2018, 2026):
    m0, m1 = pd.Period(f"{year}-06", "M"), pd.Period(f"{year + 1}-06", "M")
    ids = [i for i in rosters[year]["entity_id"] if i in panel.columns]
    ret = (panel.loc[m1, ids] / panel.loc[m0, ids] - 1).dropna()
    spy_ret = bench.loc[m1] / bench.loc[m0] - 1
    print(f"{year}-{str(year + 1)[2:]}  index {spy_ret * 100:6.1f}%  "
          f"median {ret.median() * 100:6.1f}%  beat {(ret > spy_ret).mean() * 100:5.1f}%")
Full script with formatting and visualisation: share-of-stocks-beating-the-index-python.py
Output
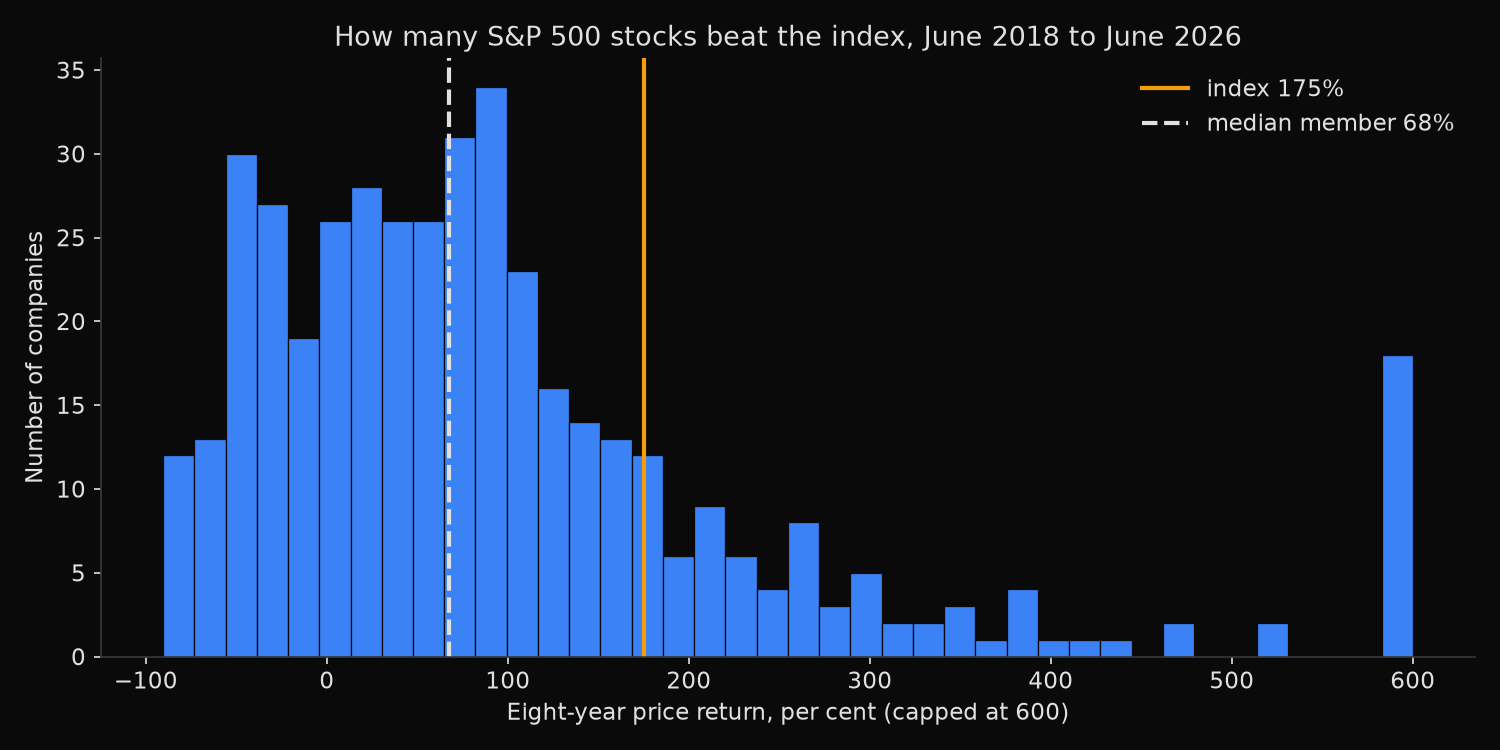
June-to-June holding years, point-in-time S&P 500 members
   year   n  index_pct  median_pct  mean_pct  beat_pct
2018-19 477        8.0         7.1       5.6      48.2
2019-20 483        5.2        -8.6      -7.0      30.8
2020-21 488       38.8        41.6      49.1      54.1
2021-22 489      -11.9       -12.2     -10.1      49.7
2022-23 488       17.5         8.8      12.9      38.3
2023-24 494       22.8         6.5      10.1      26.1
2024-25 491       13.5         8.6      11.8      43.4
2025-26 485       20.9         7.9      20.8      35.3

Eight-year buy and hold, June 2018 roster, 428 names with a full price history
  index price return           175.3%
  member median                 67.7%
  member mean                  144.1%
  beat the index                19.4% of names
  best decile share of the aggregate profit  63.0%

  strongest five, current symbol
    AMD       3775%
    NVDA      3278%
    KLAC      2843%
    LRCX      2407%
    MU        2101%
  weakest five, current symbol
    PRGO       -86%
    XRX        -87%
    FMC        -87%
    DXC        -89%
    NKTR       -90%
What this tells us
Over one year the coin is close to fair, and over eight years it is not. The annual beat rate sits between 26.1% and 54.1%, median near 41%, so in a single year a randomly chosen member has roughly a two-in-five chance of beating the index. Compound that eight times and the share falls to 19.4%. Losing slightly more often than winning, repeatedly, produces a distribution in which four names in five finish behind.
The gap between the median and the mean is where the mechanism sits. Across the eight years the median member gained 67.7% while the average member gained 144.1%, more than twice as much, and both statistics describe the same 428 companies. The mean is pulled upward by a right tail the median cannot see: AMD returned 3775%, Nvidia 3278%, and the best 10% of names produced 63% of the aggregate profit. The histogram shows a dense body between minus fifty and plus one hundred per cent with a thin tail running past six hundred.
Note which years the beat rate collapses in. The two worst readings, 26.1% in 2023-24 and 30.8% in 2019-20, are both years when the index rose on a narrow group of very large companies, and the second is the more striking: the index gained 5.2% while the median member lost 8.6%. A cap-weighted index does not need most of its members to work. It needs its largest members to work.
The losing tail is ordinary rather than exotic: Xerox, DXC Technology, FMC and Perrigo were all established constituents in June 2018, and each lost more than 85% over the eight years while remaining listed.
So what?
The base rate for a concentrated stock picker inside the S&P 500 is worse than most position sizing assumes. If one member in five beats the index over eight years, a ten-stock portfolio drawn without skill expects two winners, and the return of the whole book turns on whether either lands in the far right tail. That payoff structure argues for holding more names rather than fewer, since breadth is what makes the tail reachable at all.
Before trusting any cross-sectional signal, build the universe from point-in-time rosters and check what the top decile is doing. A screen that appears to add value may only be capturing exposure to the handful of names that carried the period, and the test is how much of the backtest return survives when that decile is removed.
Built with xfinlink — free financial data API for Python.