
Does the Golden Cross Work? 50/200 Moving Average Crossover Backtest in Python
August 6, 2026
What’s the question?
The golden cross is the most widely reported signal in technical analysis. A moving average is the mean closing price over the last N sessions, recomputed daily; when the 50-day rises above the 200-day the chart is called bullish, and the reverse, a death cross, is read as the exit. CNBC ran the S&P 500’s July 2020 golden cross as a story.
The rule is mechanical: hold the asset while the fast average sits above the slow one, hold cash otherwise. Both averages come from the same prices, so it filters trend rather than forecasting it.
A rule that sits in cash for a third of two decades will earn less than owning the asset outright. The question is what it returns in exchange, and whether that exchange has held up.
The approach
Eight liquid ETFs carry the test: SPY (US large caps), IWM (US small caps), EFA (developed markets outside the US), EEM (emerging markets), XLK (technology), XLE (energy), TLT (long Treasuries) and LQD (investment grade credit). A trend filter should behave differently on a series that trends and one that does not.
- Pull daily total returns and split-adjusted closes from January 2004, a year before the window opens, so both averages are warm on the first day measured.
- Screen the panel. A fund missing any session SPY traded, or carrying a daily return beyond plus or minus 50 percent, leaves the sample. All eight pass, on 5,033 sessions from 2005 to 2024.
- Go long when the 50-day average sits above the 200-day as of the previous close. That one-session lag matters: acting at the close that produced the crossover is look-ahead.
- Compound the daily total return on long days, zero on flat days. Cash earns nothing, the harshest assumption available.
- Repeat with three other average pairs and on three sub-periods.
Sharpe is annualised return over annualised volatility, no risk-free deduction. Drawdowns come from daily closes.
Code
import numpy as np
import pandas as pd
import xfinlink as xfl

xfl.set_api_key("YOUR_API_KEY")  # free at https://xfinlink.com/signup

TICKERS = ["SPY", "IWM", "EFA", "EEM", "XLK", "XLE", "TLT", "LQD"]
START, END = "2005-01-01", "2024-12-31"

px = xfl.prices(TICKERS, start="2004-01-01", end=END,
                fields=["close", "adj_close", "return_daily"])
px = px.drop_duplicates(["ticker", "date"]).sort_values(["ticker", "date"])

def stats(r):
    cagr = (1 + r).prod() ** (252 / len(r)) - 1
    vol = r.std() * np.sqrt(252)
    curve = (1 + r).cumprod()
    return cagr, vol, cagr / vol, (curve / curve.cummax() - 1).min()

for t in TICKERS:
    g = px[px["ticker"] == t].set_index("date")
    sma_f = g["adj_close"].rolling(50).mean()
    sma_s = g["adj_close"].rolling(200).mean()
    hold = (sma_f > sma_s).shift(1).loc[START:END].fillna(False)

    bh = g.loc[START:END, "return_daily"]
    rule = bh.where(hold, 0.0)
    trades = int((hold.astype(int).diff().abs() == 1).sum())

    print(f"{t:4} buy and hold {stats(bh)[0]:6.2%} CAGR {stats(bh)[3]:7.1%} drawdown | "
          f"rule {stats(rule)[0]:6.2%} CAGR {stats(rule)[3]:7.1%} drawdown | "
          f"{hold.mean():.1%} invested, {trades} trades")
Full script with formatting and visualisation: golden-cross-50-200-moving-average-backtest-python.py
Output
Golden cross (50/200 day) versus buy and hold, 2005-01-01 to 2024-12-31
8 ETFs, daily total returns, out-of-market days earn nothing

                                          buy and hold           50/200 crossover rule
                            CAGR     Vol  Sharpe  MaxDD      CAGR     Vol  Sharpe  MaxDD  InMkt Trades
SPY  US large cap        10.29%  19.03%    0.54 -55.2%    8.94%  13.28%    0.67 -33.7%  77.6%     18
IWM  US small cap         7.79%  24.22%    0.32 -59.0%    1.73%  16.71%    0.10 -51.1%  68.8%     28
EFA  Developed ex-US      4.70%  21.28%    0.22 -61.0%    2.87%  13.16%    0.22 -37.6%  65.4%     27
EEM  Emerging markets     5.24%  27.98%    0.19 -66.4%    3.58%  17.59%    0.20 -42.5%  61.9%     32
XLK  Technology          14.23%  22.11%    0.64 -53.0%   10.84%  16.84%    0.64 -31.1%  77.0%     22
XLE  Energy               7.38%  30.15%    0.24 -71.3%    8.57%  19.71%    0.43 -32.0%  64.4%     27
TLT  Long Treasuries      3.16%  14.80%    0.21 -48.4%    3.06%  11.13%    0.27 -22.1%  52.1%     29
LQD  IG corporate bonds   3.88%   8.62%    0.45 -25.0%    2.05%   5.66%    0.36 -21.8%  55.9%     30
mean                      7.08%  21.02%    0.35 -54.9%    5.20%  14.26%    0.36 -34.0%  65.4%   26.6

Averaged across the eight funds
  return given up a year            1.88%
  volatility removed                6.76%
  worst drawdown, buy and hold     -54.9%
  worst drawdown, crossover rule   -34.0%
  Sharpe, buy and hold               0.35
  Sharpe, crossover rule             0.36

Moving average pair, averaged over the same eight funds
 fast/slow     CAGR     Vol  Sharpe   MaxDD  InMkt  Trades
  20/100      4.85%  13.22%    0.38  -29.0%  62.2%    62.1
  50/150      5.22%  14.02%    0.39  -34.3%  64.1%    34.4
  50/200      5.20%  14.26%    0.36  -34.0%  65.4%    26.6
 100/300      4.70%  14.88%    0.32  -37.6%  64.5%    18.8

Sub-periods, averaged over the eight funds
        window   BH CAGR  Rule CAGR  BH MaxDD  Rule MaxDD
     2005-2009     5.19%      7.83%    -50.0%      -21.3%
     2010-2024     7.82%      4.44%    -40.9%      -33.7%
     2015-2024     6.92%      4.19%    -40.3%      -33.6%

Signal life
  long spells across the eight funds        113
  spells lasting under three months         16 (14%)

Checks
  SPY 2008 calendar total return   -36.81%  (published: -36.8%)
  SPY 2013 calendar total return    32.31%  (published: +32.3%)
  SPY CAGR from daily returns       10.29%
  SPY CAGR from monthly returns     10.27%
  SPY 2020 crossovers              2020-03-30 death, 2020-07-09 golden
What this tells us
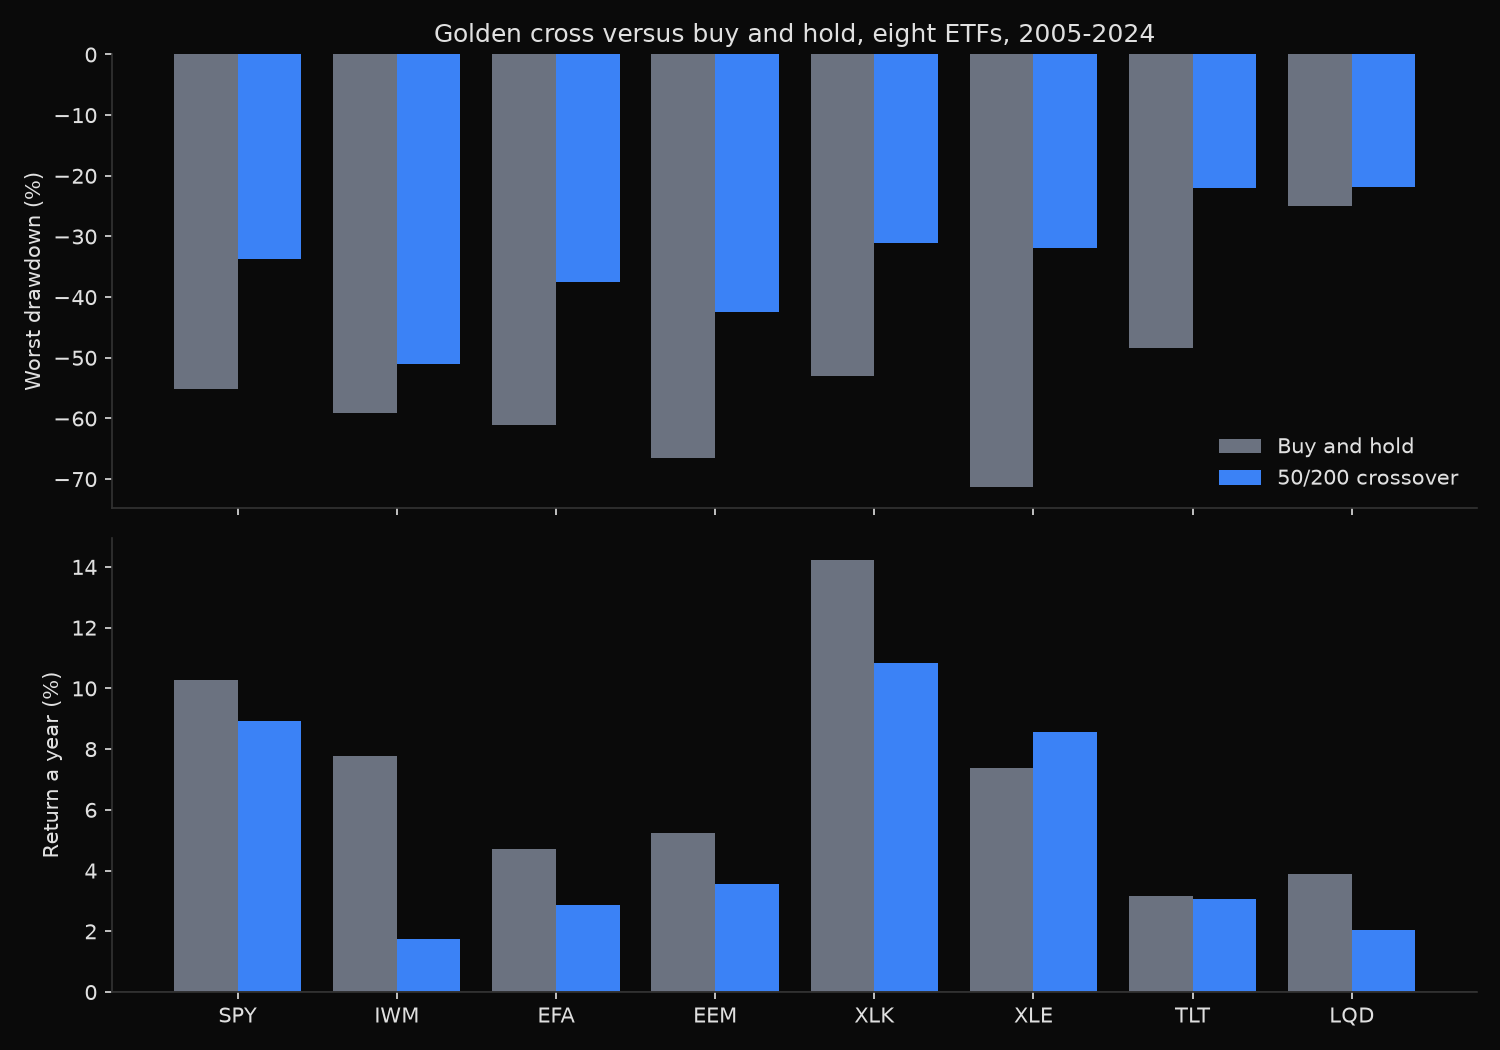
The rule is not a return generator. Averaged over the eight funds it earned 5.20 percent a year against 7.08 percent for buying and holding, and lost on seven of the eight. Energy is the exception, 8.57 percent against 7.38 percent, fitting a series that alternated between long advances and long declines rather than drifting upward. Small caps were the worst case, 1.73 against 7.79 percent.
Risk is where it pays. Average volatility fell from 21.02 percent to 14.26 percent and the average worst drawdown from 54.9 percent to 34.0 percent, so return per unit of risk barely moved, 0.35 against 0.36. The 1.88 point annual gap is the premium on that insurance. Part of it is an artefact of the zero cash assumption: the rule holds cash 34.6 percent of the time, so each point of cash yield adds about 0.35 points a year back.
The sub-periods change the verdict. Over 2005 to 2009 the rule beat buying and holding by 2.64 points a year and cut the average drawdown from 50.0 percent to 21.3 percent; over the fifteen years since, it lost 3.38 points a year and improved the drawdown by 7.2 points. One slow bear market paid for the strategy, and the 2020 crash shows why nothing since repeated it: on SPY the death cross fired on 30 March 2020, five sessions after the low, so the rule sold near the bottom and waited until 9 July to buy back. A 200-day window cannot react to a decline that takes five weeks.
Parameter choice drives none of this. Across 20/100, 50/150, 50/200 and 100/300 the annual return stays between 4.70 and 5.22 percent and the worst drawdown between 29.0 and 37.6 percent, faster pairs cutting drawdowns further and trading far more.
So what?
Treat the golden cross as a drawdown constraint rather than a source of return. Where a mandate punishes deep losses more than it rewards compounding, under two points a year to cut the worst peak-to-trough loss by 21 points is defensible. Where the objective is terminal wealth, the same numbers argue against it.
Two conditions decide whether it earns its keep on an asset: the decline has to be slow enough for a 200-day average to catch, and the asset has to mean-revert over multi-year horizons rather than compound upward. Energy satisfies both, small caps neither, where the rule destroyed 78 percent of the buy-and-hold return.
Run the sub-period split before adopting any trend filter. A signal that delivers its whole edge in one crisis is priced on a single observation, whatever the full-sample Sharpe reports.
Built with xfinlink — free financial data API for Python. pip install -U xfinlink
pip install -U xfinlink