
Does Fast Earnings Growth Persist? Rank Correlation Analysis in Python
July 30, 2026
What's the question?
Almost every valuation method extrapolates. A discounted cash flow projects earnings forward from a recent growth rate; a growth screen sorts on trailing earnings expansion and buys the top of the list. Both assume that fast earnings growth today makes fast earnings growth tomorrow more likely than average.
I. M. D. Little tested that assumption in 1962 and could not find it. Across 522 British companies over 1951 to 1959, high past earnings growth predicted nothing about later growth, and he titled the paper "Higgledy Piggledy Growth" to make the point stick. Chan, Karceski and Lakonishok reported the same for US stocks in 2003: the count of firms stringing together several years of above-median earnings growth is close to what coin flipping produces.
The result is old and still routinely ignored. This tests it on current filings, splitting a question that usually gets merged: earnings growth and revenue growth are different series, and only one persists.
The approach
Persistence here means the Spearman rank correlation between a company's growth in one window and its growth in the next. It reads ordering only, so one fortyfold earnings jump cannot drive the result.
- Universe: point-in-time S&P 500 membership as of 31 December of each formation year, 2004 through 2019, so cohorts hold the index members of that date, not the survivors. Financial and real estate names drop out, since interest and rental income are not operating revenue.
- Growth: annual restated income statements, fiscal years 2001 to 2024. Formation growth is the annualised three-year change from t-3 to t; forward growth is the cohort median ratio of t+k to t, annualised.
- Base handling: growth from a loss or a near-zero base is arithmetic noise, so both ends of the formation window require net income above $10m and above 1 percent of revenue, on base-year revenue above $100m.
- Comparability: annual revenue must agree within 10 percent with the four quarterly filings covering the year, and the two period ends in any growth calculation must sit twelve months apart. A spin-off, a discontinued operation or a fiscal-calendar change leaves a year that does not line up with the quarters inside it, and growth measured across such a year is not comparable.
- Ranking: trim 1 percent from each tail of formation growth inside each formation year, sort into quintiles, then track cohort medians for five years.
One detail decides whether the answer is credible. Growth from t-3 to t and growth from t to t+3 share year t, so a one-off item in year t lifts the first rate and depresses the second, manufacturing negative correlation from nothing. The test repeats on windows sharing no fiscal year.
Code
import numpy as np
import pandas as pd
import xfinlink as xfl
from scipy import stats

xfl.set_api_key("YOUR_API_KEY")  # free at https://xfinlink.com/signup

FORM_YEARS = range(2004, 2020)
snaps = {y: xfl.index("sp500", as_of=f"{y}-12-31") for y in FORM_YEARS}
uni = pd.concat([d.assign(form_year=y) for y, d in snaps.items()], ignore_index=True)
tickers = sorted(uni["ticker"].unique())


def pull(period_type):
    return pd.concat([xfl.fundamentals(tickers[i:i + 80], start="2000-01-01", end="2025-12-31",
                                       period_type=period_type, version="restated",
                                       fields=["revenue", "net_income"], max_rows=100000)
                      for i in range(0, len(tickers), 80)], ignore_index=True)


ann, qtr = pull("annual"), pull("quarterly")
members = set(uni["entity_id"])          # tickers get re-used; match on entity_id
ann = ann[ann["entity_id"].isin(members) & (ann["revenue"] > 0)]
ann = ann[~ann["gics_sector"].isin({"Financials", "Real Estate"})].copy()
qtr = qtr[qtr["entity_id"].isin(members) & (qtr["revenue"] > 0)].sort_values("period_end")
qmap = {e: (g["period_end"].values, g["revenue"].values)
        for e, g in qtr.drop_duplicates(["entity_id", "period_end"]).groupby("entity_id")}


def quarter_sum(eid, p_end):        # a reporting-basis change breaks comparability
    ends, revs = qmap.get(eid, (np.array([]), np.array([])))
    m = (ends > np.datetime64(p_end - pd.Timedelta(days=320))) & (ends <= np.datetime64(p_end))
    return revs[m].sum() if m.sum() == 4 else np.nan


ann["qsum"] = [quarter_sum(r.entity_id, r.period_end) for r in ann.itertuples()]
ann = ann[(ann["revenue"] / ann["qsum"] - 1).abs() <= 0.10]
ann["year"] = ann["period_end"].dt.year - (ann["period_end"].dt.month < 6).astype(int)
ann = ann.sort_values("period_end").drop_duplicates(["entity_id", "year"], keep="last")

k = list(zip(ann["entity_id"], ann["year"]))
PE, REV, NI = dict(zip(k, ann["period_end"])), dict(zip(k, ann["revenue"])), dict(zip(k, ann["net_income"]))


def spaced(eid, y0, y1, n):         # the two period_ends really are n years apart
    a, b = PE.get((eid, y0)), PE.get((eid, y1))
    return a is not None and b is not None and abs((b - a).days - n * 365.25) <= 60


def base_ok(eid, y):                # no growth from a loss or a near-zero base
    n, r = NI.get((eid, y)), REV.get((eid, y))
    return n is not None and not pd.isna(n) and n >= 10.0 and n >= 0.01 * r


rows = []
for t in FORM_YEARS:
    for eid in set(uni.loc[uni["form_year"] == t, "entity_id"]):
        r0, r1 = REV.get((eid, t - 3)), REV.get((eid, t))
        if r0 is None or r1 is None or r0 < 100 or not spaced(eid, t - 3, t, 3):
            continue
        rec = {"form_year": t, "rev_form": (r1 / r0) ** (1 / 3) - 1}
        ni_ok = base_ok(eid, t - 3) and base_ok(eid, t)
        if ni_ok:
            rec["ni_form"] = (NI[(eid, t)] / NI[(eid, t - 3)]) ** (1 / 3) - 1
        for lag, b in [("next", t), ("skip", t + 1)]:   # skip shares no fiscal year
            if not spaced(eid, b, b + 3, 3):
                continue
            rb, rf, nf = REV.get((eid, b)), REV.get((eid, b + 3)), NI.get((eid, b + 3))
            if rb is not None and rf is not None:
                rec[f"rev_{lag}"] = rf / rb
            if ni_ok and base_ok(eid, b) and nf is not None and not pd.isna(nf):
                rec[f"ni_{lag}"] = nf / NI[(eid, b)]
        rows.append(rec)

d = pd.DataFrame(rows)
for col in ["rev_form", "ni_form"]:                    # 1% trim inside each formation year
    s = d.groupby("form_year")[col]
    d.loc[~d[col].between(s.transform(lambda x: x.quantile(0.01)),
                          s.transform(lambda x: x.quantile(0.99))), col] = np.nan

for var in ["rev", "ni"]:
    for lag in ["next", "skip"]:
        rho = [stats.spearmanr(g[f"{var}_form"], g[f"{var}_{lag}"]).statistic
               for _, g in d.dropna(subset=[f"{var}_form", f"{var}_{lag}"]).groupby("form_year")]
        print(f"{var} {lag} mean rho {np.mean(rho):.3f}, positive in "
              f"{sum(np.array(rho) > 0)}/{len(rho)} formation years")
Full script with formatting and visualisation: earnings-growth-persistence-rank-correlation-python.py
Output
============================================================================
SAMPLE  point-in-time S&P 500, formation years 2004-2019
============================================================================
  distinct tickers queried                 810
  annual rows returned / entities          15533 / 731
  duplicate (entity, period_end) rows      0
  entities excluded by entity matching     22
  rows without four comparable quarters    365
  rows outside the reporting-basis screen  304
  entities surviving all screens           557
  firm-formation-years, revenue            4628
  firm-formation-years, net income         3863

============================================================================
NET INCOME  median annualised growth, by formation-window growth quintile
============================================================================
  quintile      n   formation     +1yr    +2yr    +3yr    +4yr    +5yr
  Q1         781     -11.53%   16.09%  13.14%   9.15%   8.58%   7.25%
  Q2         769       1.91%    4.38%   5.42%   5.39%   4.93%   4.57%
  Q3         769       8.51%    5.39%   6.17%   5.74%   5.19%   4.58%
  Q4         769      16.70%    6.99%   4.65%   5.11%   4.82%   4.40%
  Q5         775      37.35%    2.27%   3.25%   2.57%   2.34%   2.93%
  all       3863       9.07%    6.52%   6.24%   5.61%   5.04%   4.71%
  Q5 - Q1              48.89pp  -13.81pp  -9.89pp  -6.59pp  -6.24pp  -4.32pp

============================================================================
REVENUE  median annualised growth, by formation-window growth quintile
============================================================================
  quintile      n   formation     +1yr    +2yr    +3yr    +4yr    +5yr
  Q1         929      -2.90%    2.07%   2.38%   2.97%   2.49%   2.41%
  Q2         926       2.31%    3.05%   2.86%   2.63%   2.71%   2.82%
  Q3         920       5.77%    5.01%   4.84%   4.55%   4.38%   4.13%
  Q4         926       9.57%    6.58%   6.05%   5.98%   6.04%   5.52%
  Q5         927      20.46%    9.78%   8.82%   8.34%   8.17%   7.84%
  all       4628       6.03%    5.16%   4.77%   4.69%   4.47%   4.23%
  Q5 - Q1              23.36pp    7.71pp   6.43pp   5.37pp   5.68pp   5.43pp

============================================================================
SPEARMAN RANK CORRELATION between consecutive 3-year growth windows
============================================================================
  form_year     n   revenue  earnings | no shared base:  revenue  earnings
  2004       168     0.224    -0.123 |                   0.208    -0.224
  2005       183     0.355    -0.034 |                   0.077    -0.277
  2006       193     0.181    -0.248 |                   0.186    -0.246
  2007       225     0.287    -0.108 |                   0.320    -0.043
  2008       224     0.306    -0.185 |                   0.312    -0.118
  2009       213     0.074    -0.292 |                   0.196    -0.108
  2010       250     0.216    -0.218 |                   0.189    -0.001
  2011       222     0.201    -0.020 |                   0.148     0.099
  2012       208     0.062     0.004 |                  -0.011     0.009
  2013       248     0.132    -0.003 |                   0.104     0.055
  2014       242     0.298     0.033 |                   0.233     0.030
  2015       225     0.287    -0.125 |                   0.206    -0.060
  2016       243     0.272    -0.156 |                   0.373     0.158
  2017       239     0.361    -0.307 |                   0.301    -0.010
  2018       252     0.337    -0.176 |                   0.322     0.046
  2019       267     0.291     0.012 |                   0.400     0.187
  mean                   0.243    -0.122 |                   0.223    -0.031
  years > 0             16/16      3/16 |                  15/16      7/16

WHERE THE TOP FORMATION QUINTILE LANDS IN THE NEXT 3-YEAR WINDOW
  earnings  n= 719   Q1 26.4%   Q2 22.4%   Q3 15.3%   Q4 17.2%   Q5 18.6%   (20.0% each if past growth carried no information)
  revenue   n= 861   Q1 18.0%   Q2  9.8%   Q3 12.5%   Q4 19.9%   Q5 39.8%   (20.0% each if past growth carried no information)
What this tells us
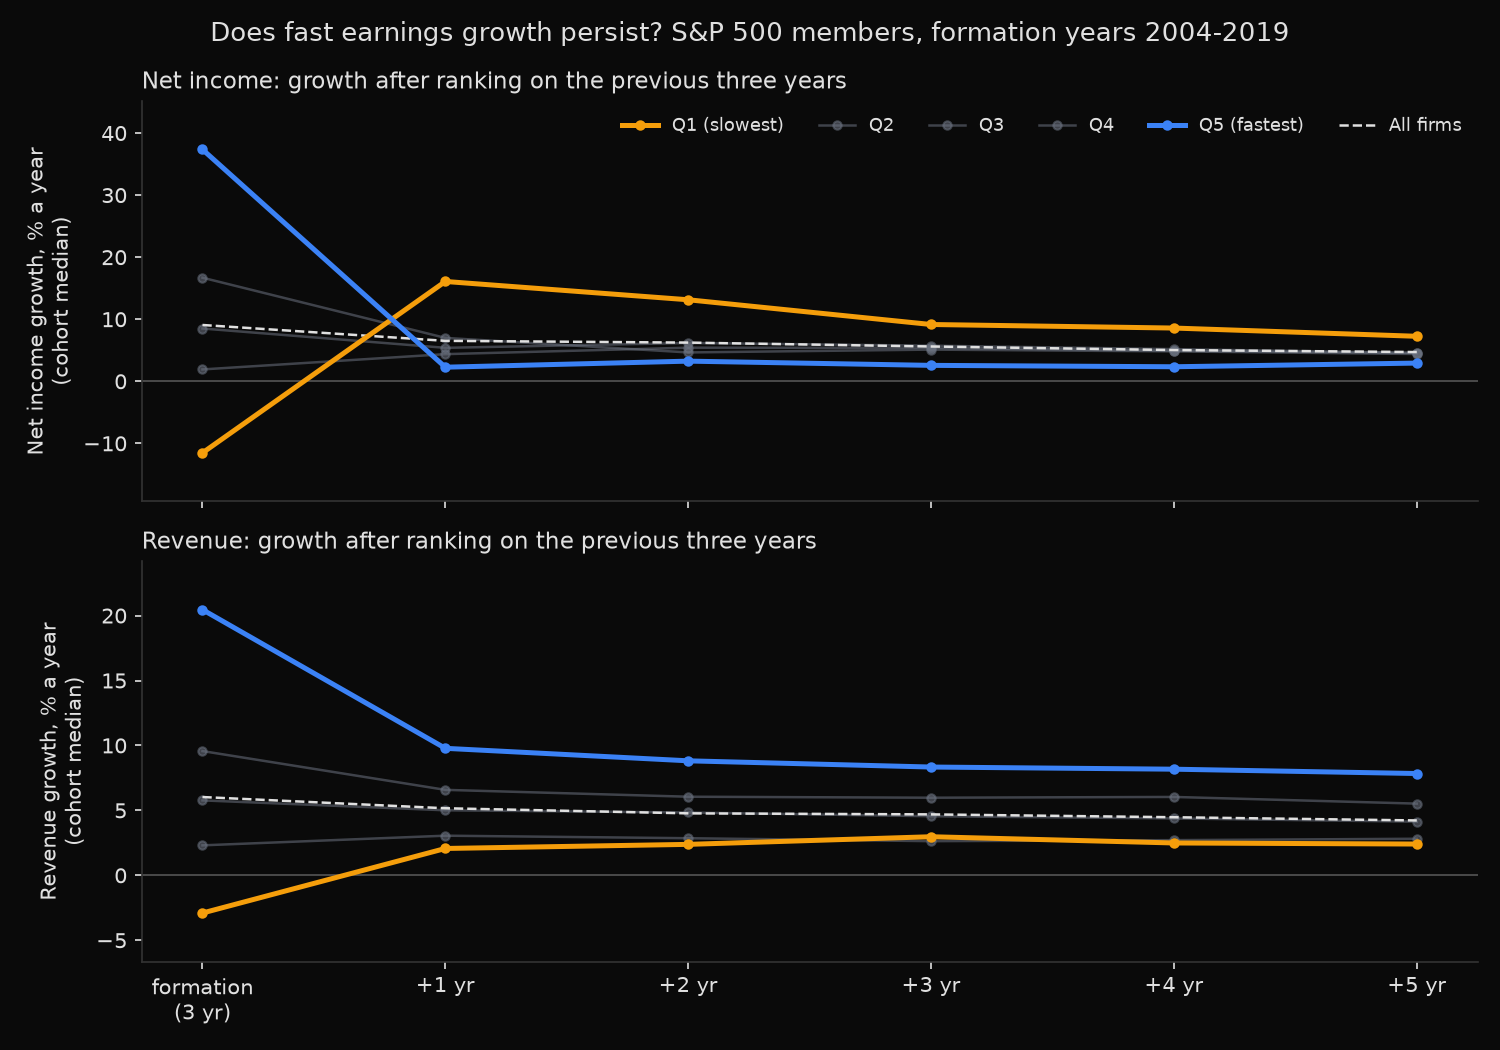
Earnings growth does not persist. It inverts. The fastest quintile compounded net income at 37.35 percent a year through formation, then managed 2.27 percent over the next year against 6.52 percent for the sample, and was still slowest five years out at 2.93 percent. The slowest quintile went from minus 11.53 percent to plus 16.09 percent. A 48.89 point gap became minus 13.81 points.
Revenue behaves nothing like this. Top-quintile sales grew 20.46 percent a year at formation and 9.78 percent the next year, roughly double the 5.16 percent sample median, with 7.84 percent still there at year five. Rank order held at every horizon, apart from the two slowest quintiles swapping at year three.
Revenue growth correlates at 0.243 between adjacent three-year windows, positive in all 16 formation years; earnings growth correlates at minus 0.122, positive in only 3. The shared-base test settles whether that is reversion or accounting. Shifting the second window to t+1 through t+4 moves earnings to minus 0.031, positive in 7 of 16 years, indistinguishable from nothing, while revenue holds at 0.223.
Transition counts agree. Of top earnings-growth quintile firms, 26.4 percent fall to the bottom quintile of the next window and 18.6 percent stay top, against 20 percent each under independence. For revenue, 39.8 percent stay top.
So what?
Extrapolate revenue, not earnings. A model anchored on trailing earnings growth projects a series with no measured persistence, and the faster that rate, the worse the overshoot. Anchored on trailing revenue growth, it rests on a rank correlation above 0.2 across three-year windows.
That argues for a structure: forecast the top line from its own history, forecast margin separately, and let earnings fall out of the two. Margin is where reversion in earnings lives, bounded by competition and cost structure rather than inflatable by a tiny denominator.
For screening, trailing earnings growth is worse than uninformative: a top-quintile grower is likelier to fall to the bottom quintile than to repeat. Revenue growth screens survive this evidence, though the top quintile's edge over the median halves within a year.
pip install -U xfinlink