Which Commodity ETFs Have the Worst Tail Risk? Expected Shortfall in Python
June 18, 2026
What's the question?
Volatility is an average measure of uncertainty. It treats upside and downside movement symmetrically. Commodity investors often need something more specific: how bad are the worst days?
Expected shortfall answers that question. It measures the average return inside the worst part of the return distribution. A 5% expected shortfall is the average daily return among the worst 5% of days. It is stricter than value at risk, which only marks the cutoff point. Expected shortfall asks what happens after that cutoff is breached.
The question is which commodity ETFs carry the most severe downside tails, and whether the ranking differs from ordinary volatility.
The approach
The universe is GLD, SLV, USO, UNG, DBA, DBB, and DBC. Built from SEC EDGAR public filings and market data, the screen uses five years of daily returns.
- Pull five years of daily returns
- Compute annualized volatility
- Compute the 5% value-at-risk cutoff
- Compute expected shortfall as the average return below that cutoff
- Compare maximum drawdown, worst day, skewness, and kurtosis
Skewness measures whether extreme moves are tilted positive or negative. Kurtosis measures whether the distribution has unusually large outliers relative to a normal distribution.
Code
import xfinlink as xfl
import pandas as pd
import numpy as np

xfl.set_api_key("YOUR_API_KEY")  # free at https://xfinlink.com/signup

tickers = ["GLD", "SLV", "USO", "UNG", "DBA", "DBB", "DBC"]
prices = xfl.prices(tickers, period="5y", fields=["return_daily"])
returns = prices.pivot_table(index="date", columns="ticker", values="return_daily").dropna()

rows = []
for ticker in tickers:
    r = returns[ticker]
    cutoff = r.quantile(0.05)
    tail = r[r <= cutoff]
    wealth = (1 + r).cumprod()
    rows.append({
        "ticker": ticker,
        "volatility": r.std() * np.sqrt(252),
        "var_5": cutoff,
        "expected_shortfall_5": tail.mean(),
        "max_drawdown": (wealth / wealth.cummax() - 1).min(),
        "kurtosis": r.kurt(),
    })

print(pd.DataFrame(rows).sort_values("expected_shortfall_5"))
Full script with formatting and visualisation: commodity-tail-risk-expected-shortfall-python.py
Output
=== Commodity ETF Tail Risk Screen ===
Universe: GLD, SLV, USO, UNG, DBA, DBB, DBC
Sample: 2021-06-21 to 2026-06-17 (1254 trading days)
Tail metric: expected shortfall across the worst 5% of daily returns
Tail-risk ranking:
UNG vol=64.1% VaR_5= -6.5% ES_5= -8.6% max_drawdown=-92.5% worst_day=2026-02-02 -24.9% skew=-0.10 kurtosis=+1.82
SLV vol=36.5% VaR_5= -3.2% ES_5= -5.2% max_drawdown=-45.4% worst_day=2026-01-30 -28.5% skew=-1.73 kurtosis=+22.24
USO vol=36.3% VaR_5= -3.5% ES_5= -5.2% max_drawdown=-36.2% worst_day=2022-03-09 -11.7% skew=-0.17 kurtosis=+3.07
DBC vol=19.2% VaR_5= -1.9% ES_5= -2.9% max_drawdown=-27.4% worst_day=2022-03-09 -7.9% skew=-0.59 kurtosis=+3.51
DBB vol=20.2% VaR_5= -2.0% ES_5= -2.8% max_drawdown=-35.0% worst_day=2022-03-09 -8.4% skew=-0.18 kurtosis=+2.43
GLD vol=18.2% VaR_5= -1.7% ES_5= -2.7% max_drawdown=-24.5% worst_day=2026-01-30 -10.3% skew=-0.72 kurtosis=+7.59
DBA vol=14.0% VaR_5= -1.4% ES_5= -2.0% max_drawdown=-15.9% worst_day=2024-05-13 -4.9% skew=-0.23 kurtosis=+1.59
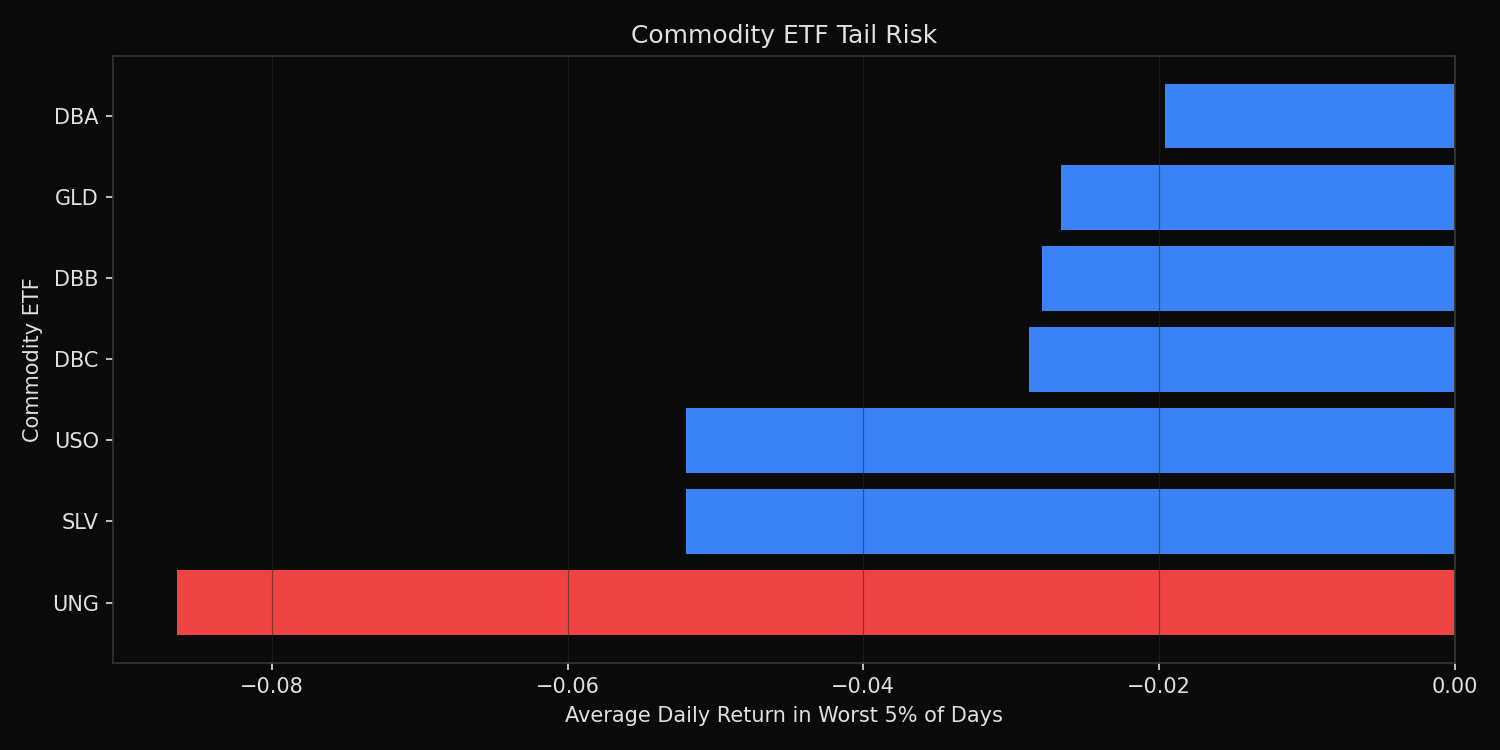
Highest tail risk: UNG with ES_5= -8.6%
Lowest tail risk: DBA with ES_5= -2.0%What this tells us
UNG has the highest tail risk by a large margin. Its annualized volatility is 64.1%, expected shortfall is -8.6%, and maximum drawdown is -92.5%. Natural gas exposure is not simply volatile; it has repeated severe downside events.
SLV and USO have similar expected shortfall, both around -5.2%, but the shape of the risk differs. SLV shows much higher kurtosis at +22.24, meaning its tail risk is more concentrated in extreme outliers. USO has a lower kurtosis reading but still carries large daily downside moves.
DBA is the lowest-risk instrument in this sample. Its expected shortfall is -2.0%, volatility is 14.0%, and maximum drawdown is -15.9%. Broad commodity exposure through DBC is safer than energy or silver, but it still has a -27.4% maximum drawdown.
So what?
Commodity allocation should not be sized from headline exposure alone. A 10% position in UNG does not carry the same risk as a 10% position in DBA or GLD. Expected shortfall makes that difference explicit.
For portfolio construction, the useful rule is to size commodity positions by tail loss rather than by capital dollars. Instruments with high expected shortfall need smaller weights, tighter drawdown limits, or explicit hedges. The worst days, not the average days, determine whether the commodity sleeve survives stress.
Built with xfinlink — free financial data API for Python. pip install -U xfinlink
pip install -U xfinlink