
How Much Are Options Sellers Overpaid? The Variance Risk Premium in Python
May 20, 2026
What’s the question?
The variance risk premium (VRP) is the difference between implied volatility (what the options market expects) and realized volatility (what actually occurs). If VRP is persistently positive, implied volatility overstates future realized moves — meaning options are systematically overpriced and sellers are compensated for bearing volatility risk. This premium is the theoretical foundation for short-volatility strategies (selling puts, covered calls, iron condors). If VRP is unstable or frequently negative, these strategies lack a structural edge.
The approach
VIX (implied vol for SPY) from FRED. SPY daily returns from xfinlink, 30-day realized vol computed from rolling 21-day standard deviation, annualized. VRP = VIX - realized vol. 8+ years of daily data.
import xfinlink as xfl
import pandas as pd
import numpy as np
import os
from fredapi import Fred

xfl.api_key = "YOUR_API_KEY"  # free at https://xfinlink.com/signup
fred = Fred(api_key=os.environ["FRED_API_KEY"])

# VIX from FRED
vix = fred.get_series("VIXCLS", observation_start="2018-01-01").rename("vix").dropna()
vix.index = pd.to_datetime(vix.index)

# SPY daily returns from xfinlink
spy = xfl.prices("SPY", start="2018-01-01", fields=["close", "return_daily"])
spy["date"] = pd.to_datetime(spy["date"])
spy = spy.set_index("date")

# 21-day realized vol, annualized
spy["rv_21d"] = spy["return_daily"].rolling(21).std() * np.sqrt(252) * 100

# Merge
merged = pd.concat([spy["rv_21d"], vix], axis=1, join="inner").dropna()
merged["vrp"] = merged["vix"] - merged["rv_21d"]

# Summary
pct_positive = (merged["vrp"] > 0).mean() * 100
print(f"Mean VIX: {merged['vix'].mean():.1f}%  Mean RV: {merged['rv_21d'].mean():.1f}%  "
      f"Mean VRP: {merged['vrp'].mean():+.1f}%  VRP positive: {pct_positive:.0f}% of days")

# By year
merged["year"] = merged.index.year
yearly = merged.groupby("year").agg(
    vix=("vix", "mean"), rv=("rv_21d", "mean"), vrp=("vrp", "mean")
).round(1)
print(f"\n{yearly}")
Full script with formatting and visualisation: variance-risk-premium-vrp-python.py
Output:
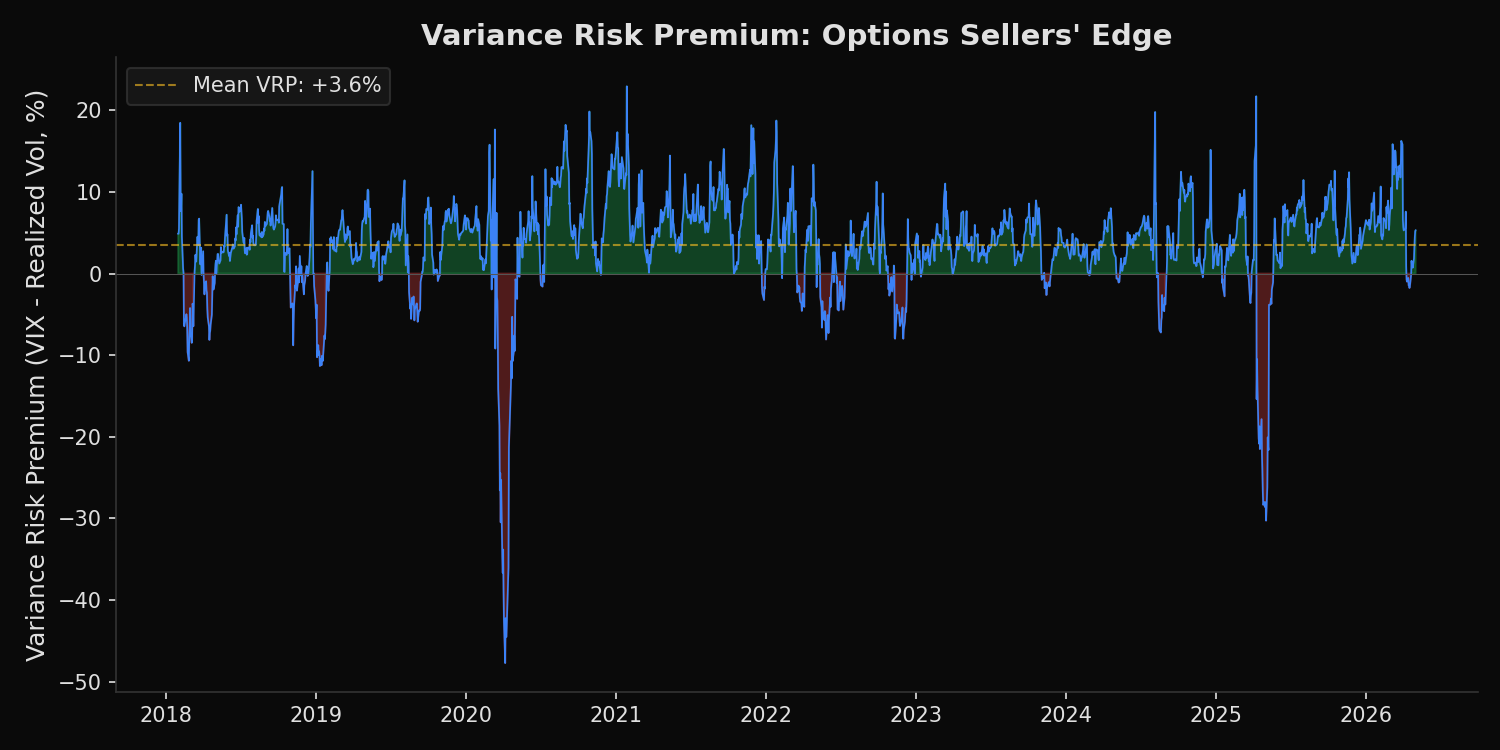
Mean VIX: 19.9%  Mean RV: 16.3%  Mean VRP: +3.6%  VRP positive: 84% of days

VRP by Year:
      vix    rv   vrp
2018  16.6  12.8   3.8
2019  15.4  11.3   4.1
2020  29.2  28.0   1.2
2021  19.7  12.4   7.3
2022  25.6  23.7   1.9
2023  17.6  12.5   5.1
2024  15.5  11.8   3.7
2025  23.4  18.5   4.9
2026  20.1  13.2   6.9

Sector Realized Vol (1Y): Tech 20.5%, Energy 20.3%, ConsStaples 12.5%
What this tells us
The VRP averages +3.6 percentage points — implied volatility is 3.6% higher than what materializes on average. This premium is positive in 84% of all trading days. It peaked in 2021 at +7.3% (VIX was elevated from pandemic memory while actual vol was low) and compressed to +1.9% in 2022 (realized vol spiked during the bear market, closing the gap). The 2026 YTD VRP of +6.9% is the second-highest in the sample, suggesting options sellers are currently being generously compensated.
So what?
The VRP confirms a structural edge for short-volatility strategies over long horizons. However, the edge is not constant — it compresses during bear markets (2022: +1.9%) when realized vol spikes. Position sizing should be inversely proportional to realized vol: sell more premium when VRP is wide and vol is low, less when VRP is narrow and vol is high. The sector vol comparison provides a secondary application: selling options on low-vol sectors (Consumer Staples at 12.5%) captures less absolute premium than high-vol sectors (Energy at 20.3%), but with lower blow-up risk.
pip install xfinlink