
What’s the question?
Revenue seasonality is the share of a fiscal year’s revenue that lands in each of that year’s four quarters. A business with no seasonality books 25 percent in each. A retailer that clears most of its inventory over the holidays does not, and neither does a tax-preparation software company whose customers all show up in April.
The consequence appears whenever two consecutive quarters are compared. A sequential revenue decline can mean the business shrank, or it can mean the calendar turned, and the number itself does not say which. Any screen ranking companies on quarter-over-quarter revenue growth treats both cases identically.
A second complication is easy to miss. Fiscal quarters are not calendar quarters: Apple’s fiscal Q1 ends in December while Costco’s fiscal Q4 ends in August, so grouping companies by the label "Q4" mixes the holiday shopping season with late summer.
The approach
The sample starts with 29 S&P 500 companies spanning retail, staples, software, hardware, industrials, healthcare and energy, over July 2015 to December 2025.
- Pull quarterly revenue, collapsing any records that describe the same reporting period into a single row.
- Derive the fiscal quarter position from the data instead of the calendar. A quarter whose period end matches an annual period end is that company’s fiscal Q4, and the three before it are Q3, Q2 and Q1. Calendar month is never used, which matters because only 12 of these companies close their books in December.
- Keep companies whose quarters run consecutively, allowing gaps of 75 to 130 days for 52/53-week calendars and for Costco’s 16-week fourth quarter.
- Require each fiscal year’s four quarters to reconcile to the company’s own reported annual revenue within 1 percent. Restatements after a divestiture leave some years unreconciled; those years drop, and a company needs eight reconciling years to stay in.
- Take each quarter’s share of its fiscal year, average by quarter position, and use the highest minus the lowest average as the seasonality statistic.
That leaves 28 companies and 269 fiscal years; Johnson & Johnson reconciles in seven and drops. The derived positions agree with the fiscal period recorded on each filing for 1,176 of 1,177 quarters, and 276 of the 283 complete fiscal years reconcile to within 0.01 percent. Walmart’s year ending 31 January 2025 sums to 674,538 against a reported 674,538, and Apple’s year ending 27 September 2025 sums to 416,161 against 416,161.
Code
import pandas as pd
import xfinlink as xfl

xfl.set_api_key("YOUR_API_KEY")  # free at https://xfinlink.com/signup

TICKERS = ["HD", "LOW", "TGT", "BBY", "ROST", "NKE", "WMT", "COST", "KO", "PG",
           "CL", "KMB", "MSFT", "ADBE", "ORCL", "CRM", "INTU", "AAPL", "HON",
           "CAT", "UNP", "EMR", "JNJ", "ABT", "MRK", "UNH", "XOM", "CVX", "COP"]
START, END = "2015-07-01", "2025-12-31"

qtr = xfl.fundamentals(TICKERS, period_type="quarterly", start=START, end=END, fields=["revenue"])
ann = xfl.fundamentals(TICKERS, period_type="annual", start=START, end=END, fields=["revenue"])

# Fiscal quarter POSITION, derived from the data: a quarter whose period end matches
# an annual period end is that company's fiscal Q4. Calendar month is never used.
frames = {}
for t, g in qtr.groupby("ticker"):
    g = g.sort_values("period_end").reset_index(drop=True)
    gaps = g["period_end"].diff().dt.days.dropna()
    ends = ann.loc[ann["ticker"] == t, "period_end"]
    q4 = [i for i, d in enumerate(g["period_end"]) if (ends - d).abs().dt.days.min() <= 7]
    if len(g) < 38 or not gaps.between(75, 130).all() or g["revenue"].le(0).any():
        continue
    if len(q4) < 5 or len({i % 4 for i in q4}) != 1:
        continue
    g["fq"] = (g.index - q4[0] + 3) % 4 + 1
    frames[t] = g
q = pd.concat(frames.values(), ignore_index=True)

# Complete fiscal years that reconcile to the company's reported annual revenue.
q["block"] = q.groupby("ticker")["fq"].transform(lambda s: (s == 1).cumsum())
q["n_in_block"] = q.groupby(["ticker", "block"])["fq"].transform("size")
q["fy_rev"] = q.groupby(["ticker", "block"])["revenue"].transform("sum")
q["fy_end"] = q.groupby(["ticker", "block"])["period_end"].transform("max")
fy = q[q["n_in_block"] == 4].merge(
    ann[["ticker", "period_end", "revenue"]].rename(
        columns={"period_end": "fy_end", "revenue": "annual"}),
    on=["ticker", "fy_end"], how="inner")
fy["recon"] = (fy["fy_rev"] - fy["annual"]).abs() / fy["annual"]
fy = fy[fy["recon"] <= 0.01]
fy = fy[fy.groupby("ticker")["block"].transform("nunique") >= 8]
fy["share"] = fy["revenue"] / fy["fy_rev"]

prof = fy.pivot_table(index="ticker", columns="fq", values="share", aggfunc="mean")
prof.columns = [f"Q{c}" for c in prof.columns]
prof["spread"] = prof.max(axis=1) - prof.min(axis=1)
prof["peak"] = prof[["Q1", "Q2", "Q3", "Q4"]].idxmax(axis=1)
prof = prof.sort_values("spread", ascending=False)

# The quarter right after the peak, read sequentially and year-over-year.
q = q[q["ticker"].isin(prof.index)].copy()
q["qoq"] = q.groupby("ticker")["revenue"].pct_change(1)
q["yoy"] = q.groupby("ticker")["revenue"].pct_change(4)
for t in prof.index:
    nxt = int(prof.loc[t, "peak"][1]) % 4 + 1
    s = q[(q["ticker"] == t) & (q["fq"] == nxt)].dropna(subset=["qoq", "yoy"])
    print(f"{t:6}{prof.loc[t, 'spread']:8.1%}{s['qoq'].median():9.1%}{s['yoy'].median():9.1%}"
          f"{int(((s['qoq'] < 0) & (s['yoy'] > 0)).sum()):>6}/{len(s)}")
Full script with formatting and visualisation: quarterly-revenue-seasonality-python.py
Output
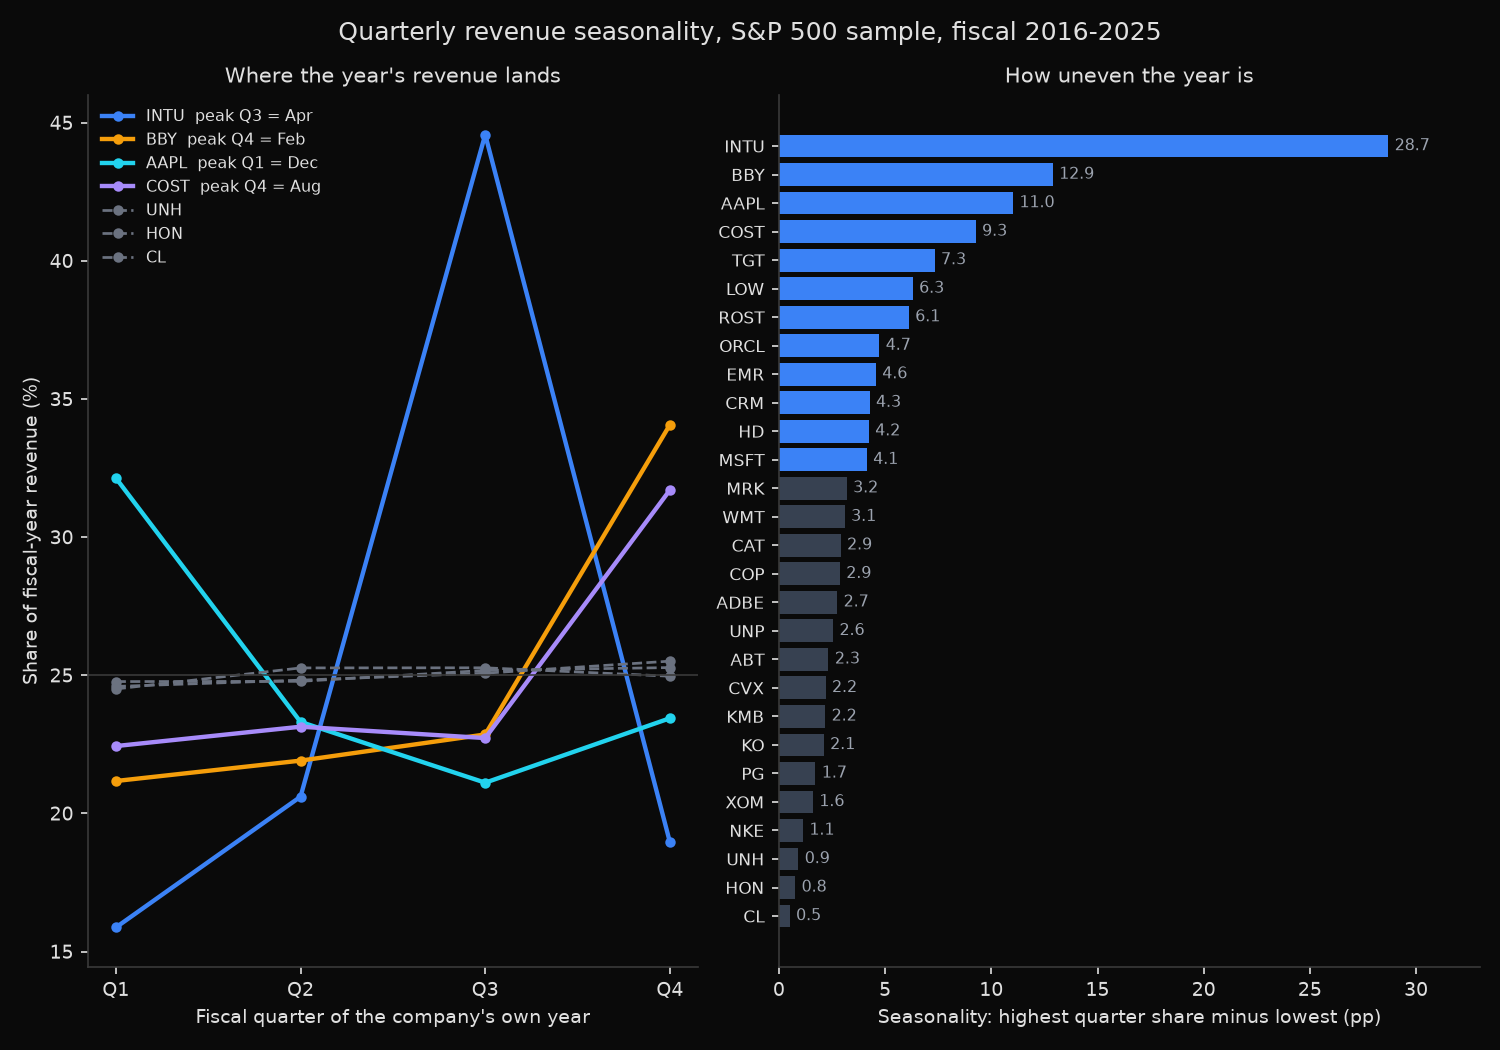
Companies screened: 29   in final sample: 28   fiscal years used: 269

Share of fiscal-year revenue by fiscal quarter position
            Q1      Q2      Q3      Q4   spread  peak  yrs  sector
INTU     15.9%   20.6%   44.6%   19.0%    28.7%    Q3   10  Information Technology
BBY      21.2%   21.9%   22.9%   34.1%    12.9%    Q4    9  Consumer Discretionary
AAPL     32.1%   23.3%   21.1%   23.4%    11.0%    Q1   10  Information Technology
COST     22.4%   23.1%   22.7%   31.7%     9.3%    Q4   10  Consumer Staples
TGT      22.6%   23.6%   23.8%   30.0%     7.3%    Q4    9  Consumer Staples
LOW      24.4%   28.8%   24.2%   22.5%     6.3%    Q2    9  Consumer Discretionary
ROST     22.4%   24.4%   24.7%   28.5%     6.1%    Q4    9  Consumer Discretionary
ORCL     23.1%   24.3%   24.7%   27.8%     4.7%    Q4   10  Information Technology
EMR      22.8%   24.6%   25.3%   27.3%     4.6%    Q4    8  Industrials
CRM      23.0%   24.3%   25.5%   27.2%     4.3%    Q4    9  Information Technology
HD       23.7%   27.9%   24.7%   23.7%     4.2%    Q2    9  Consumer Discretionary
MSFT     22.8%   25.7%   24.4%   27.0%     4.1%    Q4   10  Information Technology
MRK      24.9%   24.9%   26.7%   23.5%     3.2%    Q3   10  Health Care
WMT      23.7%   24.8%   24.6%   26.8%     3.1%    Q4    9  Consumer Staples
CAT      23.5%   25.3%   24.7%   26.5%     2.9%    Q4   10  Industrials
COP      26.0%   23.2%   25.4%   25.4%     2.9%    Q1   10  Energy
ADBE     23.8%   24.5%   25.2%   26.6%     2.7%    Q4   10  Information Technology
UNP      24.1%   24.1%   25.0%   26.7%     2.6%    Q4   10  Industrials
ABT      24.0%   24.6%   25.2%   26.3%     2.3%    Q4   10  Health Care
CVX      23.9%   24.3%   26.1%   25.8%     2.2%    Q3   10  Energy
KMB      25.6%   25.4%   25.6%   23.4%     2.2%    Q1   10  Consumer Staples
KO       24.0%   26.1%   25.7%   24.1%     2.1%    Q2   10  Consumer Staples
PG       25.3%   25.8%   24.1%   24.8%     1.7%    Q2   10  Consumer Staples
XOM      24.1%   24.4%   25.7%   25.7%     1.6%    Q3    8  Energy
NKE      25.6%   25.1%   24.5%   24.8%     1.1%    Q1   10  Consumer Discretionary
UNH      24.6%   24.8%   25.1%   25.5%     0.9%    Q4   10  Health Care
HON      24.5%   25.3%   25.3%   25.0%     0.8%    Q3   10  Industrials
CL       24.8%   24.8%   25.2%   25.3%     0.5%    Q4   10  Consumer Staples

Quarter after the peak: sequential read vs year-over-year read
        qtr      QoQ      YoY   gap(pp)  false drops
INTU     Q4   -56.0%    14.6%      70.7       9/10
BBY      Q1   -37.1%    -0.9%      36.2       4/9
AAPL     Q2   -24.1%     4.6%      28.7       6/9
COST     Q1   -22.0%     8.2%      30.2      10/10
TGT      Q1   -22.9%     3.4%      26.3       7/9
LOW      Q3   -15.6%     3.0%      18.5       7/10
ROST     Q1   -13.7%     5.8%      19.5       6/9
ORCL     Q1   -11.8%     4.9%      16.7      10/10
EMR      Q1   -11.9%     2.8%      14.7       7/10
CRM      Q1     1.2%    24.3%      23.1       3/9
HD       Q3   -11.5%     5.8%      17.3       9/10
MSFT     Q1    -2.1%    13.2%      15.3       7/10
MRK      Q4    -5.6%     5.2%      10.8       5/10
WMT      Q1    -7.8%     2.6%      10.4       9/9
CAT      Q1    -4.4%     4.7%       9.1       4/9
COP      Q2    -7.9%    14.9%      22.9       2/9
ADBE     Q1     3.6%    18.8%      15.2       0/9
UNP      Q1    -2.0%     2.5%       4.5       3/9
ABT      Q1    -2.7%     4.0%       6.7       6/9
CVX      Q4    -0.9%     3.0%       3.9       2/10
KMB      Q2    -0.8%     0.4%       1.2       5/9
KO       Q3    -3.2%     2.1%       5.3       5/10
PG       Q3    -6.4%     3.5%       9.9       7/9
XOM      Q4     0.0%     1.0%       1.0       2/10
NKE      Q2     0.2%     5.5%       5.3       5/10
UNH      Q1     6.0%     9.4%       3.4       0/9
HON      Q4     3.0%    -1.2%      -4.2       0/10
CL       Q1     1.9%     5.5%       3.6       1/9
What this tells us
The range across 28 large, mature, profitable companies runs from 0.5 percentage points to 28.7. Colgate-Palmolive divides its year almost evenly into quarters of 24.8, 24.8, 25.2 and 25.3 percent, while Intuit puts 44.6 percent of its revenue into fiscal Q3, the quarter ending in April, because United States personal tax returns fall due in the middle of that month. Those two companies need different reading rules, and nothing on the face of a revenue series announces which rule applies.
The fiscal-versus-calendar problem is not academic. Fifteen of these companies show their largest quarter in fiscal Q4, and those fourth quarters end in eight different calendar months, from Costco in August through Oracle in May to Target in February. Sorting by the label "Q4" groups Costco’s summer with Target’s holiday season, while sorting by calendar month splits Apple’s December quarter away from Best Buy’s January-ending one even though both capture the same shopping weeks. The flat end of the table follows the business models: Colgate, Honeywell, UnitedHealth and Nike all sit under 1.2 points of spread, because consumables, service contracts, insurance premiums and wholesale shipments accrue at close to constant rates.
The final table prices the error. For the 11 most seasonal names, 78 of 105 post-peak quarters showed a sequential revenue decline while the same quarter a year earlier was lower, meaning the decline reversed sign under a year-over-year read; Costco and Oracle did this in every observation. The median gap between the two growth readings across those companies is 23.1 percentage points, against 3.9 points and a false-decline rate of 36 of 104 for the 11 flattest names. Apple shows the mechanism: its fiscal Q2 carries a median sequential change of negative 24.1 percent against a median year-over-year change of positive 4.6 percent, and in the March 2025 quarter revenue fell 23.3 percent from the December quarter while rising 5.1 percent against March 2024. Both numbers are correct; only one describes the business. Year-ago quarters also serve as the naive benchmark in a comparison of how forecastable quarterly revenue and earnings are.
So what?
Compute the seasonal profile before comparing any two quarters and store the spread alongside the ticker. Ten years of quarterly revenue produce a single number per company that settles which comparison is legitimate.
Above roughly 4 points of spread, sequential revenue growth carries no usable information about the business; the 12 companies past that threshold here produce a phantom decline in most post-peak quarters, so use year-over-year growth instead. Below about 2 points, sequential growth is sound and reacts faster, which matters for flat names where a genuine turn otherwise stays buried for three quarters.
Any screen ranking a universe on quarter-over-quarter revenue growth is close to a ranking of who is furthest past their seasonal peak. One adjustment fixes it: divide each company’s quarter by the average share that quarter position carries in its own fiscal year, which puts Costco’s August quarter and Colgate’s March quarter on the same footing. Derive that position from period-end dates, never from calendar month, or the correction lands on the wrong quarter for half the names.
Built with xfinlink — free financial data API for Python.