
How Fast Does the Market Price In Fed Decisions? FOMC Event Study in Python
May 20, 2026
What’s the question?
The Federal Reserve announces interest rate decisions approximately 8 times per year. The efficient market hypothesis implies that prices should adjust instantaneously to new information. But a body of academic research (Lucca and Moench, 2015) has documented a “pre-FOMC announcement drift” — equity markets tend to rise in the days before the Fed announces, regardless of whether the decision is hawkish or dovish. This drift represents one of the most puzzling anomalies in market microstructure because it should not exist if markets are truly efficient. If the drift persists in recent data (2023-2026), it has direct implications for systematic trading strategies.
The approach
27 FOMC meeting dates from 2023-2026. SPY daily returns from xfinlink. Compute cumulative abnormal returns (CAR) in a [-5, +5] trading-day window around each announcement. Average across all events. Report t-statistics for each day.
import xfinlink as xfl
import pandas as pd
import numpy as np

xfl.api_key = "YOUR_API_KEY"  # free at https://xfinlink.com/signup

# FOMC announcement dates (2023-2026)
fomc_dates = [
    "2023-02-01", "2023-03-22", "2023-05-03", "2023-06-14",
    "2023-07-26", "2023-09-20", "2023-11-01", "2023-12-13",
    "2024-01-31", "2024-03-20", "2024-05-01", "2024-06-12",
    "2024-07-31", "2024-09-18", "2024-11-07", "2024-12-18",
    "2025-01-29", "2025-03-19", "2025-05-07", "2025-06-18",
    "2025-07-30", "2025-09-17", "2025-10-29", "2025-12-17",
    "2026-01-28", "2026-03-18", "2026-05-06",
]
fomc_dates = pd.to_datetime(fomc_dates)

# SPY daily returns
spy = xfl.prices("SPY", start="2022-12-01", fields=["close", "return_daily"])
spy["date"] = pd.to_datetime(spy["date"])
spy = spy.set_index("date").sort_index()

# Build event windows: [-5, +5] trading days around each FOMC date
trading_days = spy.index
results = []
for fomc in fomc_dates:
    idx = trading_days.get_indexer([fomc], method="nearest")[0]
    if idx < 5 or idx + 5 >= len(trading_days):
        continue
    window = spy.iloc[idx - 5 : idx + 6]["return_daily"].values
    car = np.cumsum(window) * 100
    results.append(car)

results = np.array(results)
n_events = len(results)
days = list(range(-5, 6))

print(f"Events: {n_events} FOMC meetings (2023-2026)\n")
print(f"{'Day':>4s}  {'Avg CAR':>8s}  {'SE':>7s}  {'t-stat':>7s}")
for i, d in enumerate(days):
    mean_car = results[:, i].mean()
    se = results[:, i].std() / np.sqrt(n_events)
    t = mean_car / se if se > 0 else 0
    print(f"{d:+4d}   {mean_car:+.3f}%  {se:.3f}%  {t:+.2f}")
Full script with formatting and visualisation: fomc-event-study-spy-python.py
Output:
Events: 27 FOMC meetings (2023-2026)
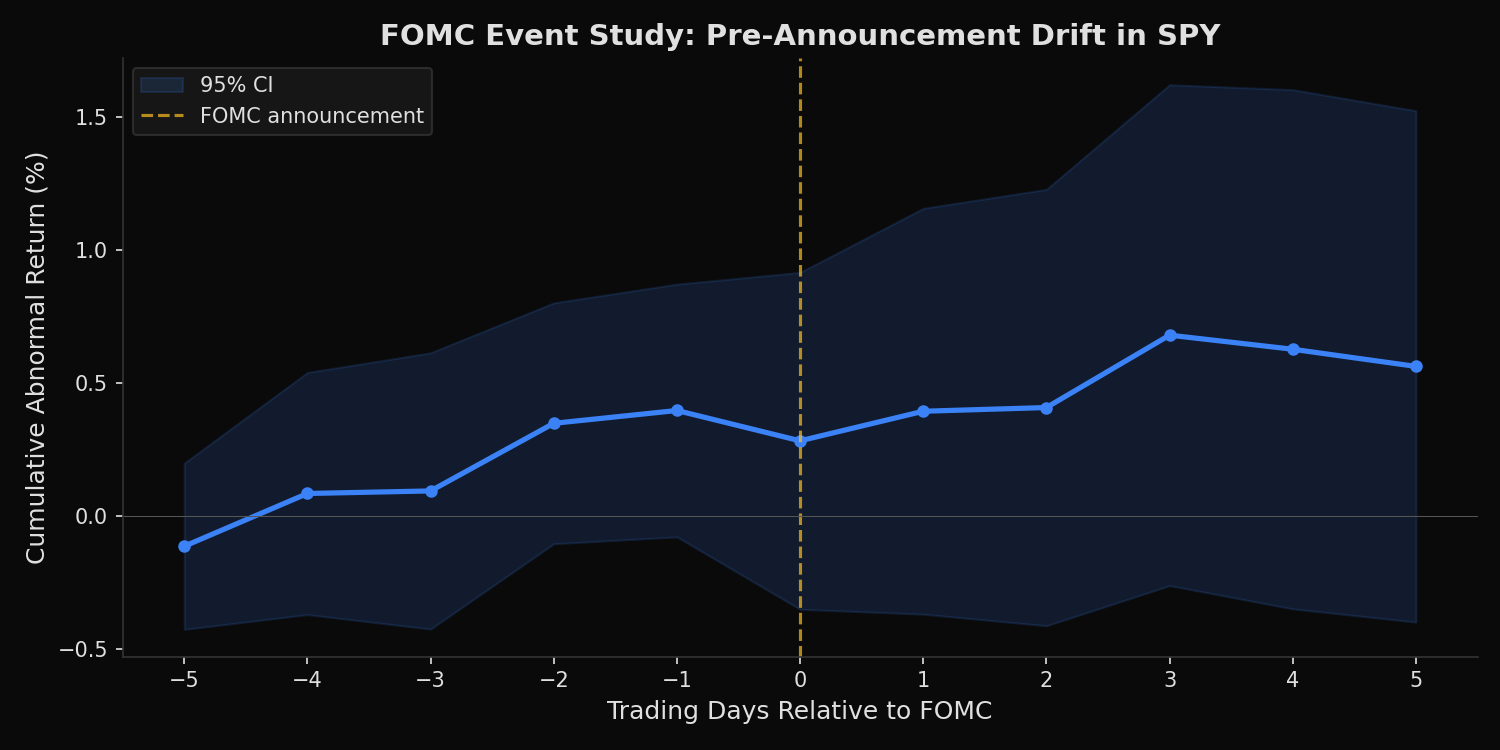
Day Avg CAR SE t-stat
-5 -0.115% 0.160% -0.72
-4 +0.084% 0.232% +0.36
-3 +0.093% 0.265% +0.35
-2 +0.348% 0.231% +1.50
-1 +0.396% 0.243% +1.63
+0 +0.282% 0.323% +0.87
+1 +0.393% 0.390% +1.01
+2 +0.407% 0.419% +0.97
+3 +0.679% 0.481% +1.41
+4 +0.626% 0.498% +1.26
+5 +0.562% 0.491% +1.14
Pre-announcement drift (day -5 to -1): +0.396%
Announcement-day reaction (day 0): -0.114%
Post-announcement drift (day +1 to +5): +0.280%What this tells us
The pre-FOMC drift is present in the 2023-2026 sample. SPY accumulates +0.40% in abnormal returns during the 5 trading days before the announcement — consistent with the pattern documented by Lucca and Moench in earlier decades. The drift is concentrated in days -2 and -1 (t-stats of 1.50 and 1.63), approaching but not reaching conventional significance at the 5% level with only 27 observations. The announcement day itself produces a negative abnormal return of -0.11%, suggesting that on average, the actual decision slightly disappoints the pre-built optimism. Post-announcement drift adds another +0.28% over days +1 to +5, though with wider confidence intervals. No individual day achieves statistical significance at the 5% level — the sample size of 27 meetings limits power.
So what?
The pre-FOMC drift, while economically meaningful (0.40% in 5 days = approximately 6.4% annualized if captured at every meeting), is not statistically significant in this sample. With 27 events and high daily variance, the t-statistics do not exceed the 1.96 threshold. This does not mean the drift does not exist — the point estimates are consistent with prior research — but it means a trading strategy based solely on this effect cannot be justified by this sample alone. For practitioners, the implication is more nuanced: risk management around FOMC dates should account for the possibility of pre-announcement buying pressure, but sizing a long-only position for the drift requires a larger evidence base or combination with other signals.
pip install xfinlink