
Are Companies Leaving the S&P 500 Faster Than They Used To? Index Survival Analysis in Python
July 26, 2026
What's the question?
Corporate longevity briefings from Innosight put average S&P 500 tenure at 33 years in 1964 and 24 years in 2016, projecting 12 by 2027. The figure has become shorthand for accelerating creative destruction.
Average tenure is harder to measure than it looks. The obvious calculation takes every company that has left the index, measures how long each stayed, and averages. A company still in the index contributes nothing, because its tenure has not finished. Statisticians call this right-censoring, and the error does not cancel out: the memberships still running are the long ones, so dropping them pulls the average down, and it pulls hardest on recent cohorts.
So a measured decline could be real, or it could be an artifact. That is falsifiable: does a statistic immune to censoring show the same decline? The censoring-free version is a fixed-horizon survival rate. Take every company that joined the index in a given year and ask what fraction was still in it ten years later. Every member of the cohort has a definite answer, so nobody is dropped.
The approach
The S&P 500 membership event log runs from 3 July 1957 to 7 May 2026 and holds 2,605 dated additions and removals. Point-in-time rosters come from the same source through as_of.
- Page through the whole event log with
index_events, 1,000 rows per request. - Turn the log into membership spells by counting open listings per company, since it records securities and a firm with two share classes generates two additions. 1,447 spells result.
- Group spells into five-year cohorts by joining year, restricted to 1980 through 2014 so every cohort has had a full ten years to be observed. Compute the naive number, mean tenure of ended spells, and the ten-year survival rate.
- Rebuild the estimate from rosters alone: overlap
index("sp500", as_of=Y)with the roster ten years later, matching on the spell rather than the company. - Rebuild it a third time from raw event counts: removals in a period divided by index seats gives an annual exit rate, compounding to an implied ten-year survival. Nothing is paired.
- Test 1980s cohorts against 2005 to 2014 cohorts with a two-proportion z-test.
Only dates and counts enter these calculations, and the three estimators share no logic, so agreement between them counts as evidence rather than repetition. Two limits belong on the record. Founding-roster additions are suppressed by design, since they record who was already a member when the log opens, so 42 current constituents get no cohort. Roster sizes are taken as observed at each date, 433 names in 1990 against 492 in 2026, so cohorts before 1980 are excluded and every rate is computed on the observed count rather than a nominal 500.
Code
import numpy as np
import pandas as pd
import xfinlink as xfl
from statsmodels.stats.proportion import proportions_ztest

xfl.set_api_key("YOUR_API_KEY")  # free at https://xfinlink.com/signup

HORIZON = pd.Timedelta(days=3652)  # 10 years

frames, offset = [], 0
while True:
    page = xfl.index_events("sp500", start="1957-01-01", limit=1000, offset=offset)
    if page.empty:
        break
    frames.append(page)
    offset += len(page)
    if len(page) < 1000:
        break

events = pd.concat(frames, ignore_index=True)
events["effective_date"] = pd.to_datetime(events["effective_date"])
events = events.sort_values(["entity_id", "effective_date"])

# a spell runs from the addition that opens membership to the removal that ends it
spells = []
for entity_id, g in events.groupby("entity_id"):
    open_listings, spell_start = 0, None
    for _, row in g.iterrows():
        if row["event_type"] == "added":
            if open_listings == 0:
                spell_start = row["effective_date"]
            open_listings += 1
        elif open_listings > 0:
            open_listings -= 1
            if open_listings == 0:
                spells.append((entity_id, spell_start, row["effective_date"]))
    if open_listings > 0:  # still a member: right-censored
        spells.append((entity_id, spell_start, pd.NaT))

sp = pd.DataFrame(spells, columns=["entity_id", "added", "removed"])
sp["cohort"] = sp["added"].dt.year
sp["bucket"] = (sp["cohort"] // 5) * 5
sp["tenure"] = (sp["removed"] - sp["added"]).dt.days / 365.25

w = sp[sp["cohort"].between(1980, 2014)].copy()
w["survived_10y"] = np.where(
    w["removed"].isna(), 1, (w["removed"] > w["added"] + HORIZON).astype(int)
)

cohorts = w.groupby("bucket").agg(
    additions=("added", "size"),
    naive_tenure=("tenure", "mean"),        # biased: ended spells only
    survival_10y=("survived_10y", "mean"),  # censoring-free
)

# second estimator: roster overlap 10 years apart, keyed on the membership
# spell (entity_id + added_date) so two spells of one company cannot match
def spell_keys(as_of):
    snap = xfl.index("sp500", as_of=as_of)
    return set(zip(snap["entity_id"], snap["added_date"])), len(snap)

retention = []
for year in range(1980, 2015):
    now, size = spell_keys(f"{year}-01-01")
    later, _ = spell_keys(f"{year + 10}-01-01")
    retention.append((year, size, len(now & later) / len(now)))

ret = pd.DataFrame(retention, columns=["year", "roster", "retained_10y"])
ret["bucket"] = (ret["year"] // 5) * 5
cohorts = cohorts.join(ret.groupby("bucket")["retained_10y"].mean())

# third estimator: exit rate from event counts alone, nothing paired
events["year"] = events["effective_date"].dt.year
removals = events[events["event_type"] == "removed"].groupby("year").size()
seats = ret.set_index("year")["roster"]
for b in cohorts.index:
    yrs = range(b, b + 5)
    rate = sum(int(removals.get(y, 0)) for y in yrs) / sum(int(seats[y]) for y in yrs)
    cohorts.loc[b, "implied_10y"] = (1 - rate) ** 10

early, late = w[w["cohort"] < 1990], w[w["cohort"] >= 2005]
zstat, pval = proportions_ztest(
    [early["survived_10y"].sum(), late["survived_10y"].sum()], [len(early), len(late)]
)
print(cohorts.round(3))
print(f"z={zstat:.2f}, p={pval:.3f}")
Full script with formatting and visualisation: sp500-membership-tenure-survival-python.py
Output
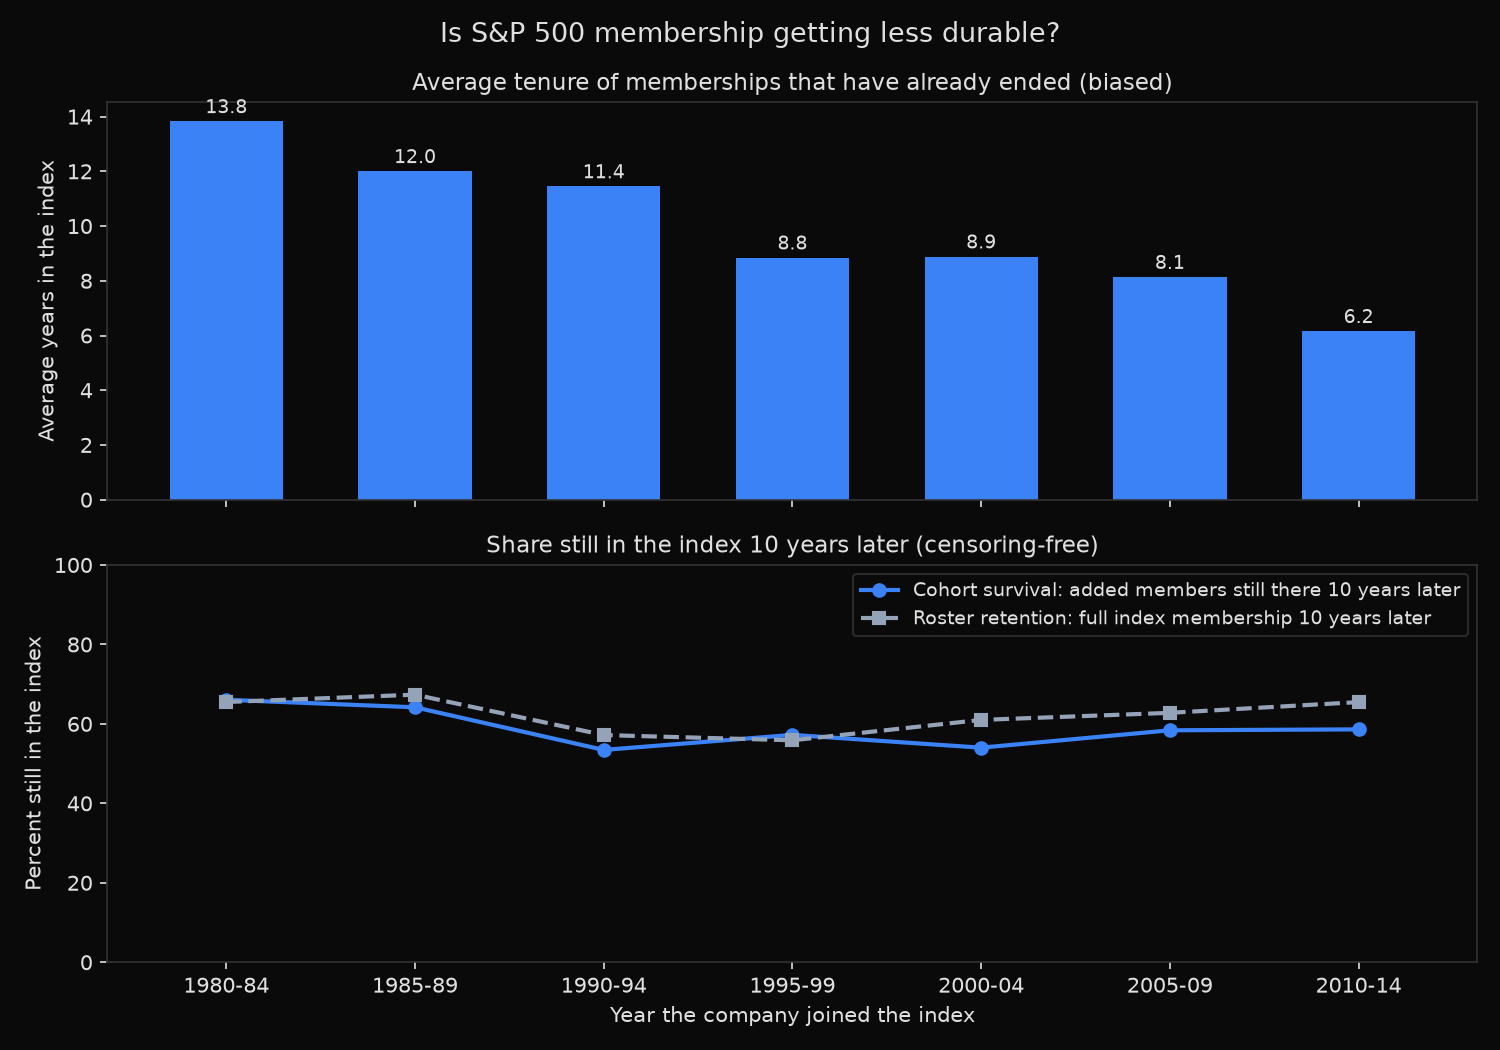
=== S&P 500 membership durability by addition cohort ===
Event log: 2605 events, 1957-07-03 to 2026-05-07. Spells reconstructed: 1447

Cohort       Added  Ended  NaiveTenure  StillIn  Surv10y  Retain10y
1980-84        112     87        13.8y     22%    66.1%      65.5%
1985-89        134    111        12.0y     17%    64.2%      67.4%
1990-94         58     49        11.4y     16%    53.4%      57.2%
1995-99        159    107         8.8y     33%    57.2%      55.9%
2000-04        137    101         8.9y     26%    54.0%      61.0%
2005-09        149     91         8.1y     39%    58.4%      62.8%
2010-14         87     42         6.2y     52%    58.6%      65.5%

Naive mean tenure of ended spells: 13.8y (1980-84) -> 6.2y (2010-14), -55%
10-year survival:                  66.1% (1980-84) -> 58.6% (2010-14)
Roster retention (independent):    65.5% (1980-84) -> 65.5% (2010-14)
Exit-rate implied survival:        67.3% (1980-84) -> 70.5% (2010-14)
Trend in 10-year survival: -2.4 pp per decade
1980s cohorts 65.0% (n=246) vs 2005-14 cohorts 58.5% (n=236): z=1.48, p=0.138
Censoring: 22% of the 1980-84 cohort is still a member and excluded from its
tenure average; 52% of the 2010-14 cohort.

Period       Exits   Roster  AnnualExit  Implied10y
1980-84         74      381       3.89%       67.3%
1985-89        103      417       4.94%       60.3%
1990-94         50      435       2.30%       79.2%
1995-99        150      442       6.78%       49.5%
2000-04        117      467       5.01%       59.8%
2005-09        140      478       5.85%       54.7%
2010-14         84      489       3.44%       70.5%

--- validation: spells vs point-in-time rosters ---
1990-01-01: roster 433, spells open 338, open but not in roster 0, in roster via founding entry 95
2005-01-01: roster 474, spells open 416, open but not in roster 0, in roster via founding entry 58
2026-01-01: roster 492, spells open 450, open but not in roster 0, in roster via founding entry 42
What this tells us
The naive number reproduces the familiar story. Mean tenure of completed memberships falls from 13.8 years for the 1980-84 intake to 6.2 years for the 2010-14 intake, a drop of 55% broken only by the 2000-04 bucket.
The censoring-free measure of the same 836 companies says otherwise. Ten-year survival was 66.1% for the earliest cohort and 58.6% for the latest, a fitted decline of 2.4 percentage points per decade, and the 1980s intake against the 2005 to 2014 intake gives z = 1.48, p = 0.138. Spell-matched roster retention lands on 65.5% at both ends, and the exit-rate estimator implies 67.3% against 70.5%. The collapse is in the statistic, not in the companies.
The StillIn column shows where it comes from. Only 22% of the 1980-84 cohort remains in the index today, so the naive average captures most of that group. For 2010-14 the figure is 52%, and every one of those survivors is past eleven years of membership, excluded by construction. The naive statistic measures how much of a cohort has finished, not how durable it is.
Exit rates themselves move far more than survival does, from 2.30% of seats per year in the early 1990s to 6.78% in the late 1990s. A cohort straddles several such periods, which is why the 1990-94 intake looks weakest despite joining in the calmest stretch on record.
So what?
Anyone quoting a corporate-longevity number should check whether the denominator includes companies still in the index; if it does not, the number falls over time whether or not durability changes. Any duration statistic computed only on completed cases inherits that flaw, average holding period and average time-to-default included.
For index research the base rate has held near 60% for forty years: a company joining the S&P 500 has roughly a 4-in-10 chance of leaving within a decade. Turnover budgets for index-tracking mandates, and any model treating membership as a decaying asset, belong on that flat rate rather than an extrapolated decline. Timing is what varies, by a factor of three between calm and turbulent stretches.
Rebuilding any of it takes one event-log pull and a loop over as_of snapshots.
Built with xfinlink — free financial data API for Python. pip install -U xfinlink
pip install -U xfinlink