
Does the S&P 500 Index Effect Still Exist? Event Study in Python
July 26, 2026
What's the question?
When S&P Dow Jones Indices adds a company to the S&P 500, every fund tracking the index must own it at the same weight by the same date. That demand is forced and price-insensitive, and the schedule is public in advance.
That mechanism produced the index effect: the abnormal gain of an added stock between announcement and inclusion. Greenwood and Sammon, in the Journal of Finance in April 2025, put the average addition return at 7.4% during the 1990s and 0.3% over the decade to 2020. Passive assets grew enormously since, so forced demand is larger than ever while the premium is supposed to have gone. The test below covers 2016 to 2024, and asks whether a pre-inclusion gain reverses.
The approach
The sample is every S&P 500 addition effective between 1 January 2016 and 31 December 2024: 193 events. Abnormal return means the stock’s daily return minus SPY’s on the same day, cumulated across a window, with beta fixed at 1.
One caveat governs everything below. The record dates the day membership took effect, not the announcement: Workday’s was announced on 6 December 2024 and took effect eleven trading days later, while ad-hoc replacements come about five days ahead. No pre-date window here is a clean announcement effect.
- Pull dated additions from a point-in-time membership record; today’s constituent list omits additions later acquired or demoted.
- Align each event to trading days, with day 0 as the first day of membership. Volume verifies that convention: index funds trade the closing auction of the last day before membership starts.
- Validate identity before using any price series: the symbol must map to the same company on the effective date, and no window may hold a one-day move beyond 60%. TWTR belonged to Tweeter Home Entertainment before Twitter.
- Require a complete return series over [-40, +60] trading days, which drops 31 events: 23 spin-offs or merger-created share classes admitted on their first trading day, and 8 whose traded history does not span the window. Survivors number 90 of 105 events in 2016-2019 and 72 of 88 in 2020-2024, so attrition does not favour either era.
Code
import numpy as np
import pandas as pd
from scipy import stats
import xfinlink as xfl

xfl.set_api_key("YOUR_API_KEY")  # free at https://xfinlink.com/signup

PRE, POST, JUMP = 40, 60, 0.60
WINDOWS = [("[-40,-11]", -40, -11), ("[-10,-1]", -10, -1), ("[-1] only", -1, -1),
           ("[0]", 0, 0), ("[+1,+5]", 1, 5), ("[+1,+20]", 1, 20), ("[+1,+60]", 1, 60)]

ev = xfl.index_events("sp500", event_type="added",
                      start="2016-01-01", end="2024-12-31")
ev["eff"] = pd.to_datetime(ev["effective_date"])

spy = xfl.prices("SPY", start="2015-08-01", end="2025-06-30",
                 fields=["return_daily"])
cal = pd.DatetimeIndex(sorted(spy["date"].unique()))
spy_ret = spy.set_index("date")["return_daily"].astype(float)

# identity windows per symbol: resolve() takes 10 tickers per call
spans, tk_all = {}, sorted(ev["ticker"].unique().tolist())
for i in range(0, len(tk_all), 10):
    for t, payload in xfl.resolve(tk_all[i:i + 10])["data"].items():
        spans[t] = [(e["entity_id"], e.get("ticker_valid_from"))
                    for e in payload.get("entities", [])]

# batch by quarter, key the panel on entity_id rather than ticker
ev["q"] = ev["eff"].dt.to_period("Q")
panel = {}
for q, g in ev.groupby("q"):
    d = xfl.prices(sorted(g["ticker"].unique().tolist()),
                   start=(g["eff"].min() - pd.Timedelta(days=95)).strftime("%Y-%m-%d"),
                   end=(g["eff"].max() + pd.Timedelta(days=100)).strftime("%Y-%m-%d"),
                   fields=["return_daily", "volume"])
    for eid, de in d.groupby("entity_id"):
        panel[(q, eid)] = de.sort_values("date").set_index("date")

paths = []
for _, r in ev.iterrows():
    hit = [s for s in spans.get(r["ticker"], []) if s[0] == r["entity_id"]]
    if not hit or (hit[0][1] and pd.Timestamp(hit[0][1]) > r["eff"]):
        continue                 # symbol did not belong to this company yet
    d = panel.get((r["q"], r["entity_id"]))
    pos = cal.searchsorted(r["eff"])
    if d is None or pos - PRE < 0 or pos + POST >= len(cal) or cal[pos] != r["eff"]:
        continue
    win = cal[pos - PRE: pos + POST + 1]
    ret = d["return_daily"].astype(float).reindex(win)
    if ret.isna().any() or ret.abs().max() > JUMP:
        continue                 # no pre-history, a trading gap, or a data break
    vol = d["volume"].astype(float).reindex(win)
    paths.append({
        "era": "2016-2019" if r["eff"] < pd.Timestamp("2020-01-01") else "2020-2024",
        "ar": (ret - spy_ret.reindex(win)).values,
        "relvol_m1": vol.iloc[PRE - 1] / vol.iloc[:PRE - 1].median()})

res = pd.DataFrame([p["ar"] for p in paths], columns=np.arange(-PRE, POST + 1))
meta = pd.DataFrame([{k: v for k, v in p.items() if k != "ar"} for p in paths])

def car(df, a, b):
    return df.loc[:, [c for c in df.columns if a <= c <= b]].sum(axis=1) * 100

print(f"median day -1 volume vs days -40..-2: {meta['relvol_m1'].median():.1f}x")
for name, a, b in WINDOWS:
    v = car(res, a, b)
    t = stats.ttest_1samp(v, 0)
    print(f"{name:<11}{v.mean():8.2f}%{v.median():8.2f}%{t.statistic:9.2f}{t.pvalue:9.4f}")
    for era in ["2016-2019", "2020-2024"]:
        print("   ", era, f"{car(res[meta['era'] == era], a, b).median():6.2f}%")
Full script with formatting and visualisation: sp500-index-effect-event-study-python.py
Output
S&P 500 additions, effective 2016-01-01 to 2024-12-31: 193 events
Complete return history over [-40,+60] trading days: 162 events (31 excluded)
  2016-2019: 90 of 105 events kept (86%)
  2020-2024: 72 of 88 events kept (82%)

Excluded events (31):
  UA     2016-04-08  did not trade on 0 of 40 days before, 1 of 61 from day 0
  FTV    2016-07-05  did not trade on 40 of 40 days before, 1 of 61 from day 0
  FTI    2017-01-17  did not trade on 0 of 40 days before, 1 of 61 from day 0
  IIN    2017-04-05  listing history does not span the event window
  INFO   2017-06-02  listing history does not span the event window
  BHF    2017-08-07  did not trade on 40 of 40 days before, 1 of 61 from day 0
  IQV    2017-08-29  did not trade on 40 of 40 days before, 55 of 61 from day 0
  DD     2017-09-01  did not trade on 0 of 40 days before, 1 of 61 from day 0
  LIN    2018-10-31  did not trade on 40 of 40 days before, 1 of 61 from day 0
  DOW    2019-04-02  did not trade on 40 of 40 days before, 1 of 61 from day 0
  CTVA   2019-06-03  did not trade on 40 of 40 days before, 1 of 61 from day 0
  BMS    2019-06-07  did not trade on 0 of 40 days before, 59 of 61 from day 0
  AMCR   2019-06-11  did not trade on 40 of 40 days before, 1 of 61 from day 0
  PSKY   2019-12-23  listing history does not span the event window
  TI     2019-12-23  listing history does not span the event window
  CARR   2020-04-03  did not trade on 40 of 40 days before, 1 of 61 from day 0
  OTIS   2020-04-03  did not trade on 40 of 40 days before, 1 of 61 from day 0
  VNT    2020-10-09  did not trade on 40 of 40 days before, 1 of 61 from day 0
  VTRS   2020-11-17  did not trade on 40 of 40 days before, 1 of 61 from day 0
  AIRC   2020-12-15  did not trade on 40 of 40 days before, 1 of 61 from day 0
  OGN    2021-06-03  did not trade on 40 of 40 days before, 1 of 61 from day 0
  CEG    2022-02-02  did not trade on 40 of 40 days before, 1 of 61 from day 0
  WBD    2022-04-11  did not trade on 40 of 40 days before, 1 of 61 from day 0
  MBC    2022-12-15  did not trade on 40 of 40 days before, 1 of 61 from day 0
  GEHC   2023-01-04  did not trade on 40 of 40 days before, 1 of 61 from day 0
  FTRE   2023-07-03  did not trade on 40 of 40 days before, 1 of 61 from day 0
  VLTO   2023-10-02  did not trade on 40 of 40 days before, 1 of 61 from day 0
  SOLV   2024-04-01  did not trade on 40 of 40 days before, 1 of 61 from day 0
  GEV    2024-04-02  did not trade on 40 of 40 days before, 1 of 61 from day 0
  SW     2024-07-08  did not trade on 40 of 40 days before, 1 of 61 from day 0
  AMTM   2024-09-30  did not trade on 40 of 40 days before, 1 of 61 from day 0

Identity re-checked against continuous price history for 4 names: COO, IIN, AOS, TI

Largest single-day moves left in the sample (checked by name)
ticker        eff max_move  max_move_day
  EPAM 2021-12-14    45.7%            51
  NKTR 2018-03-19    41.8%            53
  SMCI 2024-03-18    35.9%           -40
   HWM 2020-04-03    26.4%            -8
   AMD 2017-03-20    24.2%            30

Day-0 alignment check (effective date = first day of membership)
  median volume on day -1 vs days -40..-2: 25.3x
  share of events whose heaviest volume day in [-5,+5] is day -1: 98%
  peak-volume day distribution: {-5: 1, -1: 158, 0: 1, 3: 1, 4: 1}

Cumulative abnormal return vs SPY, market-adjusted (beta = 1)
window          mean   median   t-stat        p   % > 0
[-40,-11]      6.54%    4.88%     5.84   0.0000     67%
[-10,-1]       1.73%    0.22%     3.09   0.0023     51%
[-1] only     -0.05%   -0.25%    -0.24   0.8123     44%
[0]           -0.00%   -0.08%    -0.02   0.9829     47%
[+1,+5]       -0.22%    0.16%    -0.69   0.4900     52%
[+1,+20]      -0.20%    0.39%    -0.30   0.7622     51%
[+1,+60]      -0.71%    1.14%    -0.56   0.5785     52%

By era (median CAR, mean in brackets)
window                  2016-2019             2020-2024
[-40,-11]         4.11% (  4.91%)       6.49% (  8.59%)
[-10,-1]         -1.08% ( -0.33%)       3.46% (  4.32%)
[-1] only        -0.42% ( -0.49%)       0.15% (  0.51%)
[0]               0.11% (  0.31%)      -0.32% ( -0.40%)
[+1,+5]           0.19% ( -0.29%)      -0.02% ( -0.14%)
[+1,+20]          0.79% (  0.46%)      -0.84% ( -1.02%)
[+1,+60]          0.55% ( -0.49%)       1.38% ( -1.00%)

Does the run-up reverse? (medians)
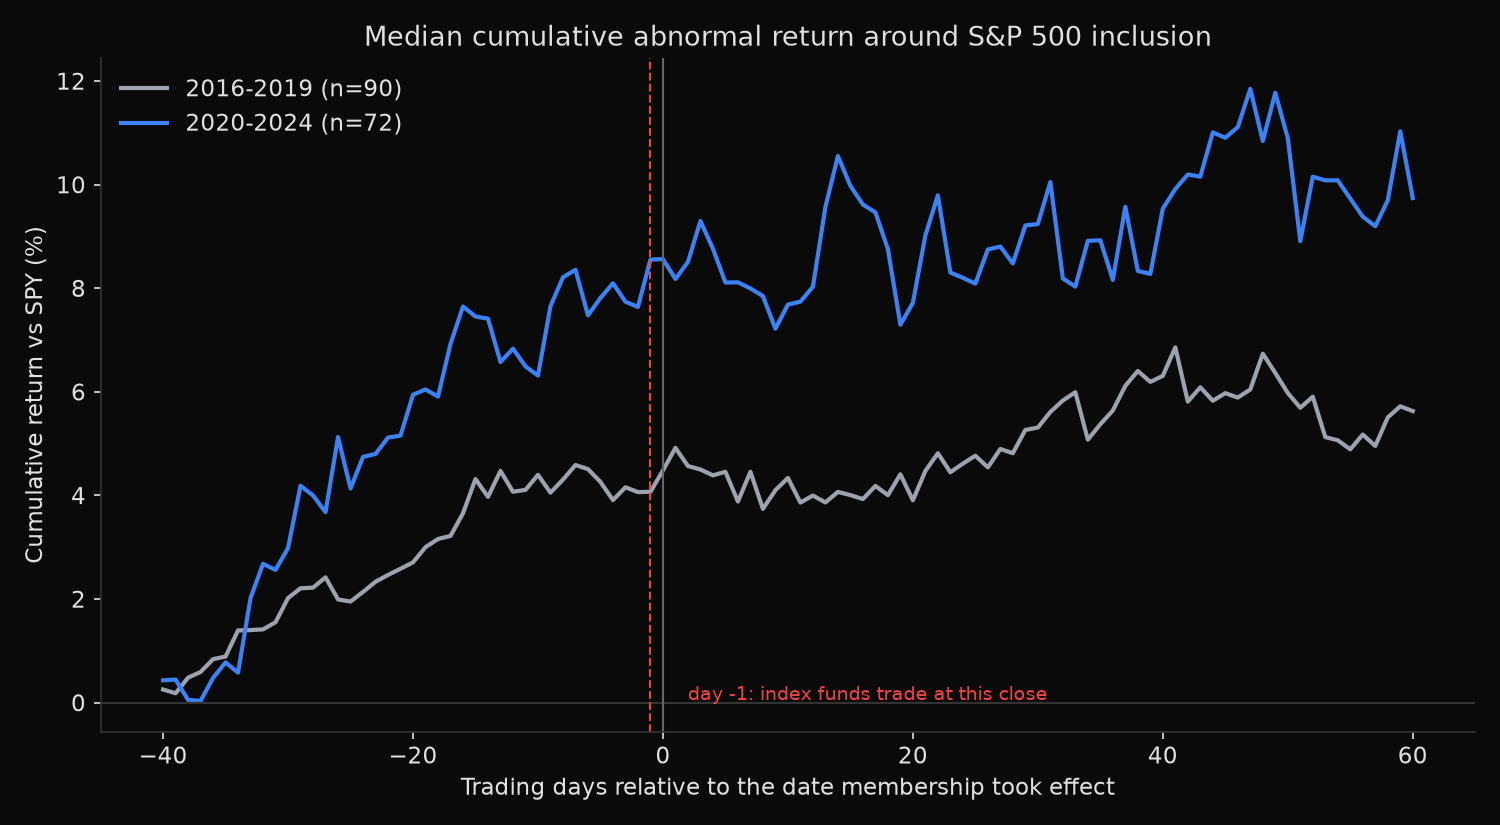
  2016-2019: [-10,-1] = -1.08%, [+1,+20] = +0.79%  ->  no run-up to reverse
  2020-2024: [-10,-1] = +3.46%, [+1,+20] = -0.84%  ->  gives back 24% of it

Largest pre-inclusion run-ups
ticker        eff  run_up   hold60
  MRNA 2021-07-21 29.4256   9.4904
  DXCM 2020-05-12 22.3826  -7.2565
  SMCI 2024-03-18 19.2331 -21.6056
  TWTR 2018-06-07 18.5090 -12.6304
Widest 60-day outcomes after inclusion
ticker        eff  run_up   hold60
  PLTR 2024-09-23 16.0064  66.8539
  ETSY 2020-09-21  0.1363  36.2518
  EPAM 2021-12-14  9.0427 -88.2098
  NKTR 2018-03-19 -1.6486 -53.1170

Median SPY return over the same [+1,+20] window: 1.71% (a beta error of 0.3 moves the estimate by 0.51pp)
What this tells us
Alignment first. For 158 of 162 events the heaviest volume day in [-5, +5] is day -1, where the median stock trades 25.3 times normal volume.
On that day the median abnormal return is -0.25%, the mean -0.05%, t-statistic -0.24. Buying large enough to lift volume twenty-five-fold clears at no measurable premium, and day 0 is flat at -0.08%.
The gain that survives testing sits far from the event: over [-40, -11] the median addition beats SPY by 4.88%, t-statistic 5.84, with 67% of events positive. That window closes before the announcement for quarterly additions, so it does not pay for index demand. It reflects how the index gets built: S&P screens on size, liquidity, float and recent profits, so a stock qualifies only after it has appreciated.
The era split holds a surprise: the close-in window did not decay but grew, from a median of -1.08% in 2016-2019 to +3.46% in 2020-2024. Who was added explains much of it, with Moderna up 29.4% before its July 2021 inclusion and Super Micro 19.2% before March 2024. The same cohort carries the wider [-40, -11] figure, pointing to selection rather than heavier late pressure.
Afterwards nothing reliable happens: every post-date window returns a p-value above 0.48. The recent cohort hands back 24% of its close-in run-up over the next 20 trading days, a median of -0.84%, while the earlier cohort has none to hand back. Means and medians disagree in sign over [+1, +60] because company news swamps index flow: EPAM lost 88.2% against SPY within 60 trading days of its December 2021 inclusion, once Russia invaded Ukraine and stranded a workforce concentrated there.
So what?
Treat the rebalance close as a liquidity event, not a price event. Volume at twenty-five times normal with a flat abnormal return means the auction absorbs size without moving price, which matters to anyone working a large order.
Buying an announced addition to sell into the rebalance has no support here beyond what momentum already provides. Fading them afterwards is weaker still: 0.84% over 20 days does not cover costs, and the tails are wide enough that sizing matters more.
The measurement lesson generalises: rebuild the universe as it stood, confirm a symbol still means the same company on the event date, and read the exclusions before trusting an average.
Built with xfinlink — free financial data API for Python. pip install -U xfinlink
pip install -U xfinlink