BLOG

Behind the numbers.

Code examples, market analysis, and data quality deep-dives.

Is MSTR a Leveraged Bitcoin Proxy? Rolling Beta Analysis in Python
Is Micron's Memory Cycle Recovering? Inventory and Margin Forecasting in Python
Which Sectors Work When Bonds Rally? Rate-Sensitive Rotation in Python
Do One-Month Price Extremes Reverse? Signal Evaluation in Python
Do Low-Volatility S&P 500 Stocks Reduce Drawdowns? Factor Test in Python
Is AI Capex Paying Back Fast Enough? Revenue Hurdle Forecasting in Python
Could Shorter AI Asset Lives Hit Earnings? Depreciation Stress Test in Python
How Much AI Capex Risk Can a Portfolio Remove? Constrained Optimization in Python
Is the AI Capex Trade Crowded? Rolling Volatility and Sector Rotation in Python
Did the AI Boom Come From Existing S&P 500 Members? Point-in-Time Momentum Test in Python
Is AI Revenue Circular? Customer-Vendor Capex Loop Analysis in Python
Is the AI Trade Connected to Private Credit? Rolling Correlation Network in Python
Is Apollo More Balance-Sheet Sensitive Than Peers? Leverage Screen in Python
Are AI Earnings Supported by Cash Flow? Accrual and Capex Screen in Python
Can Defensive Stocks Hedge AI Drawdowns? Basket Regime Test in Python
How Fast Does the Market Price In Fed Decisions? FOMC Event Study in Python
How Much Are Options Sellers Overpaid? The Variance Risk Premium in Python
Which Companies Have the Worst Earnings Quality? Sloan Accrual Screen with Geographic Revenue Data in Python
Does the Oil-to-Gold Ratio Signal Recessions? XLE/GLD Backtest in Python
Is AI Spending Crowding Out Free Cash Flow? Capex Sustainability Across the Mag 7 in Python
Does a Long Energy / Short Bonds Portfolio Capture Inflation Surprises? Factor Construction in Python
Can a Hidden Markov Model Detect Oil Market Regimes? HMM Analysis in Python
Do Grain Prices Predict Food Inflation? Granger Causality Test in Python
Does the Corporate Credit Spread Predict Stock Market Crashes? BAA-AAA Spread Analysis in Python
Do Oil Stocks Hedge Inflation? Rolling Beta Analysis in Python
Which Stocks Are Most Rate-Sensitive? Equity Duration via Bond Beta in Python
Which Companies Have the Highest Accrual Ratios? Earnings Quality Screening in Python
Is Alpha Persistent or Decaying? Rolling Sharpe Ratio Analysis in Python
Are Markets Trending or Mean-Reverting? Hurst Exponent Analysis in Python
Is Consumer Discretionary vs Staples a Leading Indicator? XLY/XLP Ratio Analysis in Python
Does Heavy Capex Predict Future Stock Returns? Capital Expenditure Analysis in Python
How to Estimate Cost of Equity Using CAPM in Python
Is Volatility Predictable? Testing for Volatility Clustering in Python
Which Industrials Are Overleveraged? Net Debt to EBITDA Screening in Python
GM Before and After Bankruptcy: Why Entity Resolution Matters for Financial Data
What Is Adjusted Beta? Merrill Lynch Beta Shrinkage in Python
How Good Is a Stock Pick? Information Ratio and Tracking Error in Python
Do Stock Returns Follow a Normal Distribution? Testing for Fat Tails in Python
Which Large Caps Have the Highest Free Cash Flow Yield? FCF Screening in Python
Which Sectors Won Over 5 Years? Sector Rotation Analysis in Python
How to Forecast Stock Volatility with GARCH Models in Python
Are Stock Prices Mean-Reverting? Augmented Dickey-Fuller Test in Python
How to Calculate CAPM Alpha and Beta with Regression in Python
How to Compare Sector Sharpe Ratios and Sortino Ratios in Python
DELL: Why Stitching Historical Price Data Together Is Wrong
How to Analyze Drawdown and Recovery for Bank Stocks in Python
How to Screen SaaS Stocks by Revenue Growth and Cash Flow in Python
How to Screen REITs by Dividend Yield and Valuation in Python
How Correlated Are the Magnificent 7? Intra-Group Correlation in Python
AAPL vs XOM: Do Individual Stocks Have Seasonal Patterns?
How to Rank Large-Cap Stocks by Momentum in Python
How to Build a Multi-Endpoint Financial Dashboard in Python
How to Compare Volatility Across Energy Stocks in Python
How to Screen Healthcare Stocks by Valuation in Python
How to Build a Sector Correlation Matrix for Portfolio Diversification in Python
How to Find Oversold and Overbought Stocks Using Z-Scores in Python
How to Measure Earnings Quality: Cash Flow vs Net Income in Python
How to Build a Multi-Factor Stock Screen in Python (Value + Momentum + Quality)
How to Build a Simple DCF Model for Any Stock in Python
How to Screen Tech Stocks by Revenue Growth in Python
How to Screen Stocks by Balance Sheet Health in Python
Is "Sell in May" Real? SPY Monthly Seasonality Over 10 Years
How to Compare Sector Performance YTD Using Python
How to Track S&P 500 Additions and Removals Over Time in Python
How to Screen Dividend Stocks by Yield and Quality in Python
How to Calculate Max Drawdown and Recovery Time for Any Stock in Python
How to Compare Profitability Across Mega-Cap Tech Stocks in Python
Why Ticker Symbols Are Unreliable: The Recycling Problem Every Quant Should Know
How to Calculate and Compare Stock Volatility in Python
How to Screen Blue-Chip Stocks by P/E Ratio in Python
How to Track Companies Through Ticker Changes, Bankruptcies, and Renames in Python
S&P 500 Turnover: How Much the Index Has Changed Since 2010
How to Calculate Stock Beta and Correlation in Python
← All articles

Is Micron's Memory Cycle Recovering? Inventory and Margin Forecasting in Python

What's the question?

Micron is one of the clearest public-market ways to study the memory semiconductor cycle. Memory markets are cyclical because supply is capital intensive and demand can change quickly. When the cycle improves, revenue often rebounds first. Margins and free cash flow usually matter more because they show whether the rebound is becoming economically durable.

The question is whether Micron's latest annual results show a high-quality recovery or only a revenue rebound. A high-quality recovery should combine revenue growth, rising margins, controlled inventory, and positive free cash flow. Inventory matters because excess inventory can signal that demand is being pulled forward or that pricing power remains weak.

The approach

The peer set is MU, NVDA, AMD, INTC, AVGO, and QCOM. The group covers memory, accelerated computing, CPUs, connectivity, and diversified semiconductor exposure. Built from SEC EDGAR public filings and market data, the analysis uses the latest two annual observations for each company.

  1. Pull revenue, gross profit, operating income, inventory, free cash flow, and capital expenditure
  2. Calculate revenue growth, gross margin, operating margin, inventory as a share of revenue, inventory growth, and free-cash-flow margin
  3. Build a cycle score from standardized revenue growth, gross margin, free-cash-flow margin, and inventory intensity
  4. Rank Micron against the peer set

The score is not a valuation model. It is a compact way to separate a real operating recovery from a lower-quality rebound.

Code

import xfinlink as xfl
import pandas as pd

xfl.set_api_key("YOUR_API_KEY")  # free at https://xfinlink.com/signup

tickers = ["MU", "NVDA", "AMD", "INTC", "AVGO", "QCOM"]
fields = ["revenue", "gross_profit", "operating_income", "inventory", "free_cash_flow"]

df = xfl.fundamentals(tickers, period_type="annual", period="6y", fields=fields)
recent = df.sort_values(["ticker", "period_end"]).groupby("ticker").tail(2)
latest = recent.groupby("ticker").tail(1).set_index("ticker")
prior = recent.groupby("ticker").head(1).set_index("ticker")

screen = pd.DataFrame(index=latest.index)
screen["revenue_growth"] = latest["revenue"] / prior["revenue"] - 1
screen["gross_margin"] = latest["gross_profit"] / latest["revenue"]
screen["inventory_to_revenue"] = latest["inventory"] / latest["revenue"]
screen["free_cash_flow_margin"] = latest["free_cash_flow"] / latest["revenue"]

print(screen.sort_values("free_cash_flow_margin", ascending=False))

Full script with formatting and visualisation: micron-memory-cycle-forecast-python.py

Output

Micron semiconductor cycle position using inventory intensity and gross margin
=== Micron Memory-Cycle Forecast Screen ===
Latest annual periods: 2025-08-28 to 2026-01-25
MU revenue growth:                48.9%
MU gross margin:                  39.8%
MU operating margin:              26.1%
MU inventory / revenue:           22.4%
MU inventory growth:              -5.9%
MU free-cash-flow margin:          4.5%
MU cycle score rank:            5 of 6

Semiconductor cycle ranking:
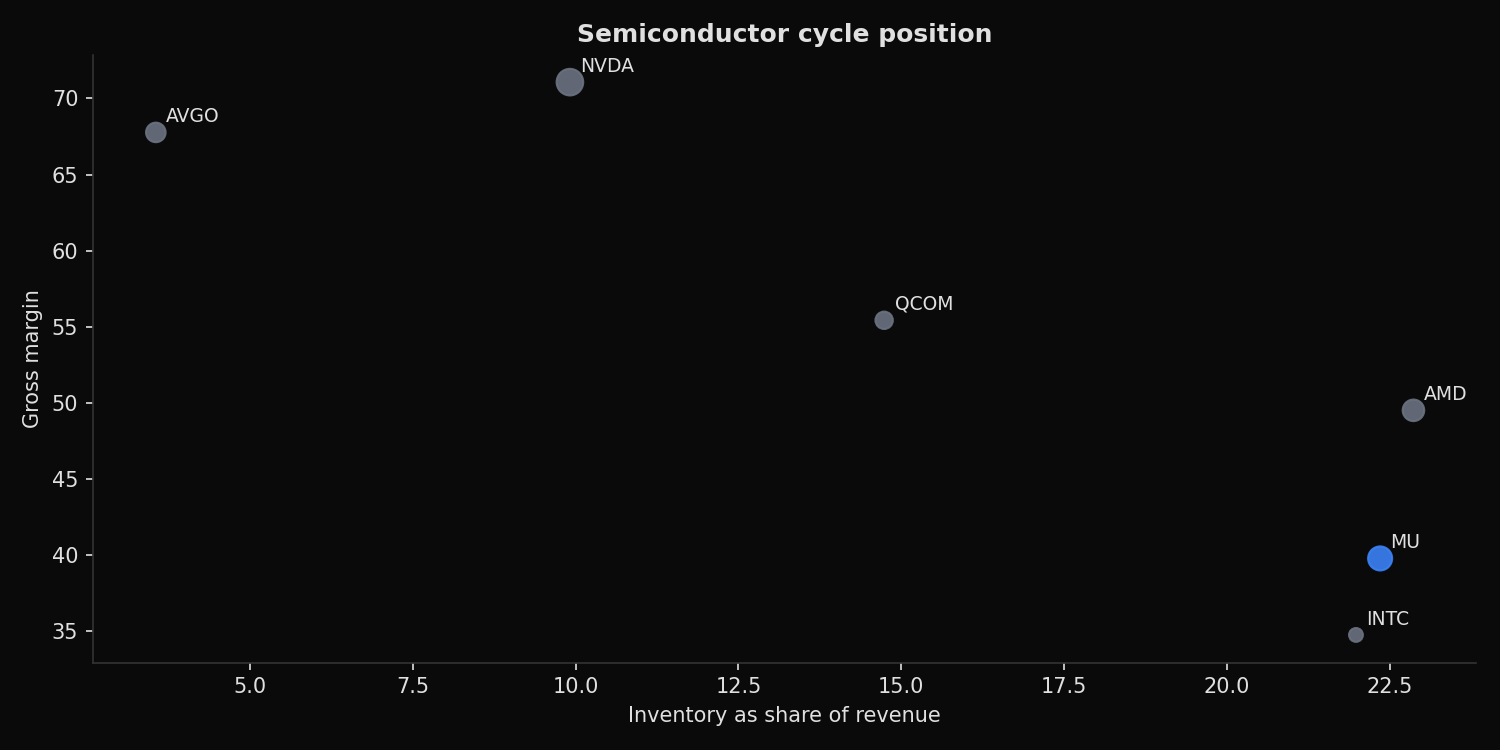
NVDA  score=  4.94  revenue_growth=  65.5%  gross_margin=  71.1%  inventory/revenue=   9.9%  FCF_margin=  44.8%
AVGO  score=  3.53  revenue_growth=  23.9%  gross_margin=  67.8%  inventory/revenue=   3.6%  FCF_margin=  42.1%
QCOM  score= -0.08  revenue_growth=  13.7%  gross_margin=  55.4%  inventory/revenue=  14.7%  FCF_margin=  28.9%
AMD   score= -1.19  revenue_growth=  34.3%  gross_margin=  49.5%  inventory/revenue=  22.9%  FCF_margin=  19.4%
MU    score= -1.95  revenue_growth=  48.9%  gross_margin=  39.8%  inventory/revenue=  22.4%  FCF_margin=   4.5%
INTC  score= -5.25  revenue_growth=  -0.5%  gross_margin=  34.8%  inventory/revenue=  22.0%  FCF_margin=  -9.4%

What this tells us

Micron's revenue recovery is real. Revenue growth is 48.9%, and inventory fell 5.9%. That combination is consistent with a memory-cycle rebound because demand is improving while inventory is not rising.

The quality of the rebound is weaker than the revenue number suggests. MU gross margin is 39.8%, operating margin is 26.1%, and free-cash-flow margin is only 4.5%. The cycle score ranks MU fifth of six, ahead of INTC but behind NVDA, AVGO, QCOM, and AMD.

The peer comparison explains the rank. NVDA and AVGO combine high margins with much lower inventory intensity. QCOM has slower growth but stronger free-cash-flow conversion. AMD has similar inventory intensity but a higher free-cash-flow margin. Micron is improving, but it has not yet converted the rebound into peer-leading cash economics.

So what?

Micron can be a cyclical recovery trade without being a high-quality compounding trade. The useful monitor is whether free-cash-flow margin follows revenue growth higher. If MU revenue keeps rising while inventory stays controlled and free cash flow expands, the recovery broadens. If growth remains strong but free-cash-flow margin stays near 4% to 5%, the trade depends more on cycle timing than on durable profitability.

For investors, the signal is clear: revenue confirms the rebound, but free cash flow confirms the quality of the rebound.

Built with xfinlink — free financial data API for Python. pip install xfinlink

Built with xfinlink — free financial data API for Python. pip install xfinlink
← All articles