Do Cheap Stocks Hold Up When Bonds Sell Off? Valuation Rotation in Python
June 15, 2026
What's the question?
Long-duration bonds tend to fall when interest-rate expectations rise. Equity investors often assume cheap stocks, measured by high earnings yield, should hold up better in that environment because more of their value comes from current earnings rather than distant growth.
Earnings yield is the inverse of the P/E ratio. A stock with a P/E ratio of 20 has an earnings yield of 5%. The question is whether a high earnings-yield basket actually outperformed a low earnings-yield basket during bond selloff weeks.
The approach
The universe is AAPL, MSFT, NVDA, AMZN, META, GOOG, JPM, XOM, JNJ, PG, HD, COST, CAT, and BA. Built from SEC EDGAR public filings and market data, the valuation sort uses latest trailing-twelve-month earnings yield. TLT is used as the long-duration bond proxy.
- Pull latest earnings yield and P/E ratio for the stock universe
- Form a high earnings-yield basket from the top five stocks
- Form a low earnings-yield basket from the bottom five stocks
- Pull three years of weekly prices for both baskets and TLT
- Compare basket returns in all weeks, TLT selloff weeks, and TLT rally weeks
A TLT selloff week is defined as a week in the bottom quintile of TLT returns.
Code
import xfinlink as xfl
import pandas as pd

xfl.set_api_key("YOUR_API_KEY")  # free at https://xfinlink.com/signup

stocks = ["AAPL", "MSFT", "NVDA", "AMZN", "META", "GOOG", "JPM", "XOM", "JNJ", "PG", "HD", "COST", "CAT", "BA"]
metrics = xfl.metrics(stocks, period_type="ttm", fields=["market_cap", "pe_ratio", "earnings_yield"])
latest = metrics.sort_values("period_end").groupby("ticker").tail(1).dropna()

ranked = latest[latest["earnings_yield"] > 0].sort_values("earnings_yield", ascending=False)
cheap = ranked.head(5)["ticker"].tolist()
expensive = ranked.tail(5)["ticker"].tolist()

prices = xfl.prices(["TLT", *cheap, *expensive], period="3y", interval="1w", fields=["adj_close"])
returns = prices.pivot_table(index="date", columns="ticker", values="adj_close").dropna().pct_change().dropna()

selloffs = returns["TLT"] <= returns["TLT"].quantile(0.20)
cheap_return = returns[cheap].mean(axis=1)
expensive_return = returns[expensive].mean(axis=1)

print(cheap, expensive)
print(cheap_return[selloffs].mean(), expensive_return[selloffs].mean())
Full script with formatting and visualisation: earnings-yield-bond-selloff-python.py
Output
=== Earnings Yield During Bond Selloffs ===
Valuation date range: 2026-03-28 to 2026-05-10
Weekly return sample: 2023-06-20 to 2026-06-08 (156 weeks)
Bond proxy: TLT
Bond selloff threshold: weekly TLT return <= -1.49%
Bond rally threshold: weekly TLT return >= 1.34%
High earnings-yield basket: JPM, META, PG, MSFT, HD
Low earnings-yield basket: NVDA, AAPL, CAT, COST, BA
Average weekly stock returns:
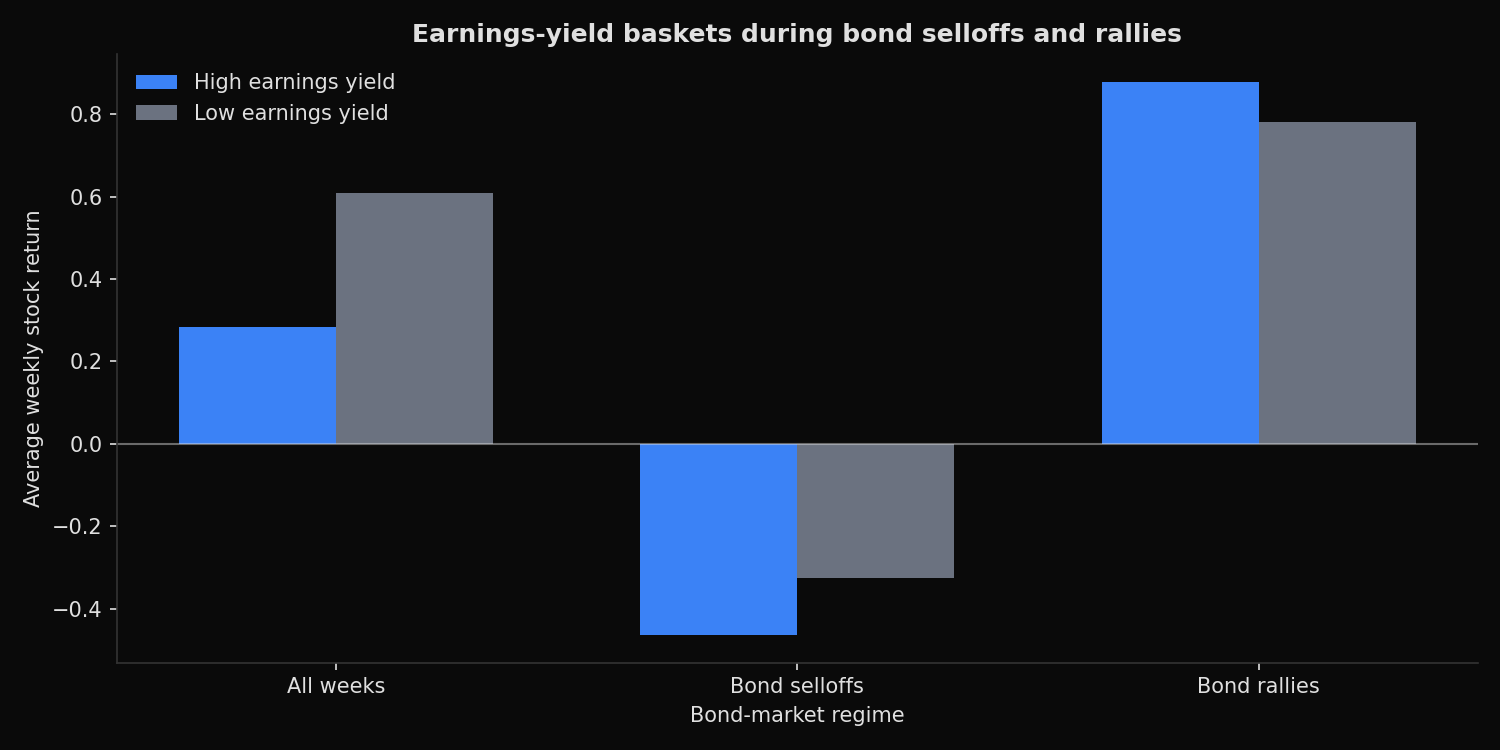
All weeks weeks=156 high_EY= 0.28% low_EY= 0.61% spread= -0.33%
Bond selloffs weeks= 32 high_EY= -0.46% low_EY= -0.32% spread= -0.14%
Bond rallies weeks= 32 high_EY= 0.88% low_EY= 0.78% spread= 0.10%What this tells us
The high earnings-yield basket did not protect capital during bond selloffs. During the 32 worst TLT weeks, the high earnings-yield basket averaged -0.46%, while the low earnings-yield basket averaged -0.32%. The spread was -0.14 percentage points.
The high earnings-yield basket also underperformed across the full sample. Its average weekly return was 0.28%, compared with 0.61% for the low earnings-yield basket. That result reflects the strength of expensive growth and industrial names in this period, especially NVDA, AAPL, CAT, COST, and BA.
Bond rally weeks show a small reversal. The high earnings-yield basket averaged 0.88%, slightly above the low earnings-yield basket at 0.78%. The difference is modest and does not support a strong rotation rule.
So what?
Cheapness alone is not a bond-selloff hedge. Earnings yield is useful for valuation discipline, but it does not automatically offset rate risk. Sector mix, earnings momentum, balance-sheet structure, and investor positioning can dominate the simple value-versus-growth story.
For portfolio construction, the result argues for testing valuation factors under explicit macro regimes. If a strategy is expected to work when bonds sell off, that claim should be measured directly. In this sample, high earnings yield did not deliver that protection.
Built with xfinlink — free financial data API for Python. pip install -U xfinlink
pip install -U xfinlink