
Does Skipping the Most Recent Month Improve Momentum? S&P 500 Decile Sorts in Python
August 5, 2026
What’s the question?
Cross-sectional momentum ranks stocks against one another on past return and holds the winners against the losers, betting the ranking persists. Almost every published version throws away the most recent month: the window runs from twelve months ago to one month ago, hence 12-1.
The reason is a second, opposite effect. Jegadeesh (1990) found that last month’s biggest gainers underperform over the following month, a reversal usually attributed to bid-ask bounce and to liquidity providers being paid to absorb one-sided flow. A twelve-month return that includes last month therefore mixes continuation with reversal, and skipping is meant to strip the reversal out. The Fama-French momentum factor uses months 2 to 12.
Two questions follow. What does the skip do to the decile spread in US large caps, and is the reversal that justifies it still there?
The approach
The universe is the S&P 500 as it stood at each formation date. Ranking today’s members over the past twenty years would rank the companies that survived, and momentum measured on survivors is not momentum.
- Pull index membership at each month end from December 2005 to June 2026, so a company removed in 2011 is ranked up to its removal and in none afterwards. The 247 snapshots cover 905 distinct companies.
- Pull monthly total returns from December 2004, keyed on entity identifier rather than ticker, so a series stays continuous through a rename and a recycled ticker cannot splice one company’s prices onto another’s.
- Screen the panel: duplicate rows and non-positive prices go, and a name whose monthly total return ever exceeds +200 percent or falls below −90 percent is set aside rather than winsorised.
- Rank every member twice, on months t-11 to t-1 (the standard 12-1 window) and on months t-11 to t (the same window with the last month left in), so the two rankings differ by one month of data and nothing else.
- Cut each ranking into ten equal-weighted deciles, hold for the following month, and repeat at the next month end. Around 479 names are ranked in a typical month.
- Rank the skipped month on its own, which measures the reversal the convention exists to remove.
Sharpe is mean return over volatility with no risk-free deduction. Drawdowns use month-end values.
Code
import numpy as np
import pandas as pd
import xfinlink as xfl

xfl.set_api_key("YOUR_API_KEY")  # free at https://xfinlink.com/signup

members = {}
for d in pd.date_range("2005-12-31", "2026-06-30", freq="ME").strftime("%Y-%m-%d"):
    ix = xfl.index("sp500", as_of=d)
    members[pd.Period(d, "M")] = sorted(int(e) for e in ix["entity_id"].dropna())

universe = sorted({e for ids in members.values() for e in ids})

px = pd.concat([xfl.prices(entity_id=universe[i:i + 20], start="2004-12-01",
                           end="2026-08-05", interval="1mo",
                           fields=["close", "return_daily"], max_rows=500000)
                for i in range(0, len(universe), 20)], ignore_index=True)

px = px.drop_duplicates(["entity_id", "date"]).dropna(subset=["return_daily"])
px = px[px["close"] > 0]
px["month"] = px["date"].dt.to_period("M")
rets = px.pivot_table(index="month", columns="entity_id", values="return_daily",
                      aggfunc="first")
rets = rets.drop(columns=[c for c in rets.columns
                          if (rets[c] > 2.0).any() or (rets[c] < -0.90).any()])

legs = {s: {k: {} for k in range(1, 11)} for s in ("skip", "noskip", "reversal")}
for T in sorted(members):
    H = T + 1                                     # the month the deciles are held
    window = rets.loc[(rets.index >= T - 11) & (rets.index <= T)]
    cols = [e for e in members[T] if e in rets.columns]
    window = window[cols]
    usable = window.notna().all() & rets.loc[H, cols].notna()
    window = window.loc[:, usable[usable].index]
    held = rets.loc[H, window.columns]

    signal = {"skip": (1 + window.iloc[:-1]).prod() - 1,   # months t-11 to t-1
              "noskip": (1 + window).prod() - 1,           # months t-11 to t
              "reversal": window.iloc[-1]}                 # month t on its own
    for name, s in signal.items():
        decile = pd.qcut(s.rank(method="first"), 10, labels=list(range(1, 11)))
        for k in range(1, 11):
            legs[name][k][H] = held[s.index[decile == k]].mean()

P = {name: pd.DataFrame({f"D{k}": pd.Series(v[k]).sort_index() for k in range(1, 11)})
     for name, v in legs.items()}
for name in P:
    P[name]["LS"] = P[name]["D10"] - P[name]["D1"]
    s = P[name]["LS"]
    print(f"{name:9} {(1 + s).prod() ** (12 / len(s)) - 1:7.2%} a year  "
          f"t = {s.mean() / (s.std() / np.sqrt(len(s))):5.2f}")
Full script with formatting and visualisation: momentum-12-1-skip-month-deciles-python.py
Output
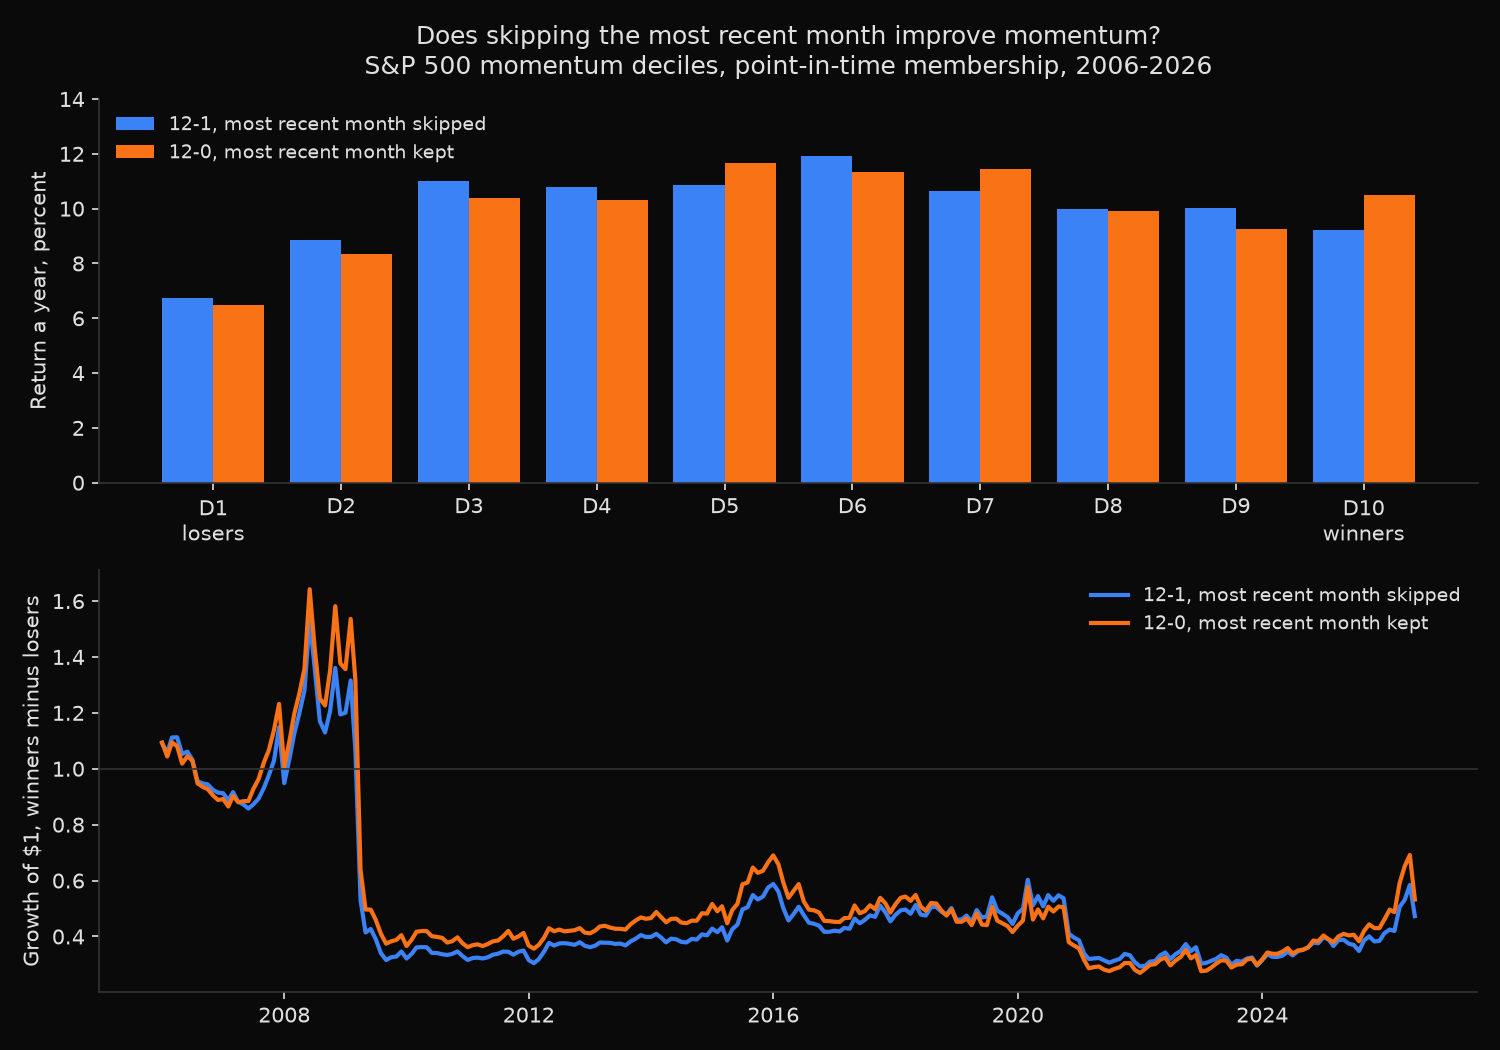
Cross-sectional momentum deciles on point-in-time S&P 500 membership, 2006-01 to 2026-07 (247 holding months)
Formation: cumulative total return over months t-11 to t-1 (12-1, most recent month skipped)
           and over months t-11 to t (12-0, most recent month kept)
Portfolios: ten equal-weighted deciles, re-formed at each month end, held one month

247 membership snapshots cover 905 distinct companies; 878 carry a monthly price history and 14 of those are set aside by the return-bound screen
Names ranked each month: 445 to 492, median 479

                         12-1 skip month           12-0 month kept
Decile             CAGR  Ann vol  Sharpe     CAGR  Ann vol  Sharpe
D1 losers         6.74%   29.55%    0.37    6.50%   30.57%    0.36
D2                8.85%   22.49%    0.49    8.36%   22.82%    0.47
D3               11.03%   19.23%    0.64   10.40%   19.85%    0.60
D4               10.77%   17.69%    0.67   10.32%   17.72%    0.65
D5               10.87%   15.98%    0.73   11.67%   15.88%    0.78
D6               11.91%   15.22%    0.82   11.35%   15.46%    0.78
D7               10.66%   15.21%    0.75   11.45%   14.78%    0.81
D8                9.97%   14.93%    0.71    9.91%   14.43%    0.73
D9               10.04%   15.07%    0.71    9.26%   14.65%    0.68
D10 winners       9.21%   18.95%    0.56   10.51%   18.57%    0.63

Winners minus losers, equal weighted, rebalanced monthly
                               12-1 skip   12-0 kept
Return a year                     -3.57%      -3.02%
Annualised volatility             24.84%      26.34%
Sharpe                             -0.01        0.03
t-statistic of monthly mean        -0.03        0.14
Worst drawdown                    -80.9%      -83.6%
Worst month                       -50.4%      -51.6%
Best month                         21.0%       26.2%
Months positive                    53.0%       53.8%
Return a year, 2009 removed        2.53%       3.08%
t-statistic, 2009 removed           0.99        1.10

How much the skip changes the ranking
  mean absolute move in percentile rank      6.2%
  names landing in the same decile           52.0%
  top decile shared by both constructions    81.1%
  bottom decile shared by both               82.7%
  correlation of the two spread series       0.979

The skipped month ranked on its own (highest minus lowest last-month return): 1.35% a year, t = 0.74
  its decile returns run 5.09% at D1 (worst last month) to 9.99% at D10 (best last month)

Winners minus losers, calendar year total return (%)
               12-1 skip         12-0 kept   last month only
2006                -8.5             -11.2              -0.7
2007                25.5              38.7              35.2
2008                 4.0              11.8              17.9
2009               -71.0             -70.6               1.9
2010                -4.6              -7.1             -15.1
2011                 5.9               9.8               5.3
2012                 4.8               0.3              -3.6
2013                 8.6              12.0               2.6
2014                 1.4               4.0              12.9
2015                42.3              38.0              -4.7
2016               -27.5             -31.6              -9.3
2017                 8.9               6.7               0.1
2018                10.5               2.4              -6.2
2019               -11.3             -16.3             -26.4
2020               -10.9             -11.5              -3.0
2021               -22.3             -23.8              -5.4
2022                17.5              19.1               3.7
2023               -18.3             -10.8               4.0
2024                27.2              28.7               6.1
2025                 2.2              12.1              26.2
2026                23.0              23.8               3.3
What this tells us
The skip changes the ranking without changing the portfolio. Dropping one month moves the median name 6.2 percentile points and leaves only 52.0% in the same decile, but that churn is in the middle of the distribution. At the ends, 81.1% of the top decile and 82.7% of the bottom are the same companies either way, and the two spread series correlate at 0.979.
The answer to the headline question is no, at least here. The 12-1 spread compounded at −3.57% a year against −3.02% for the version keeping the last month, and the 0.55 point gap sits inside the noise: t-statistics are −0.03 and 0.14. Compounded figures look worse than the averages because a long-short book pays for its own variance, and this one carries 24.84% annualised volatility.
Ranking on the skipped month alone explains why the skip is not paying. Were short-horizon reversal present, the stocks with the best return last month would lag this month. They do not. Highest minus lowest last-month return earned 1.35% a year, and the decile pattern runs upward, from 5.09% for the previous month’s worst performers to 9.99% for its best. Among S&P 500 members since 2006 the last month continues rather than reverses, so there is nothing for the skip to remove.
One year does most of the damage. In 2009 the spread lost 71.0% as the loser decile rebounded faster than any winner portfolio could follow, and the drawdown reached 80.9%. Strip 2009 out and both constructions turn positive, 2.53% and 3.08% a year, with t-statistics near 1.0.
So what?
Keep the skip. It costs nothing and protects against universes where short-horizon reversal is real, which is where it is strongest: small caps and less liquid names. What the numbers argue against is treating it as a source of return in large caps, where two decades put its contribution at half a point a year in the wrong direction.
Before tuning a formation window, rank the universe on the most recent month alone. If past-month winners lag, the correction is doing work; if they lead, as here, the convention is inherited rather than earned. What broke this strategy was the crash: a worst month of 50.4% needs a volatility target first.
For a long-only book the finding is narrower. Nothing here argues for buying the top decile, which returned less than the fifth and sixth with more volatility. Avoiding the bottom decile is the trade the data supports, 6.74% a year against roughly 10% for the rest.
Built with xfinlink — free financial data API for Python. pip install -U xfinlink
pip install -U xfinlink