
Which Sectors Work When Bonds Rally? Rate-Sensitive Rotation in Python
June 5, 2026
What's the question?
Bond rallies often signal falling interest-rate expectations, weaker growth expectations, or both. Equity sectors do not respond equally. Utilities and healthcare may benefit from lower discount rates and defensive demand. Energy may lag if the bond rally reflects weaker nominal growth. Technology can benefit from lower long-duration discount rates, but its response also depends on risk appetite.
The practical question is which sectors have recently performed best during bond-rally windows. This is a sector-rotation question. Sector rotation means shifting exposure across sectors as macro conditions change.
The approach
The bond proxy is TLT, the long-duration Treasury ETF. The equity universe is XLK, XLF, XLI, XLV, XLP, XLU, and XLE, with SPY included as the market reference. Built from SEC EDGAR public filings and market data, the analysis uses three years of daily prices.
- Calculate 21-day returns for TLT and each sector ETF
- Define bond-rally windows as the top 20% of 21-day TLT returns
- Measure each sector's average 21-day return during those windows
- Compare those returns with each sector's average return across all windows
- Report each sector's latest 63-day momentum and daily beta to TLT
This method avoids choosing a single rate-cut date. The data defines the strongest bond-rally regimes.
Code
import xfinlink as xfl
import pandas as pd

xfl.set_api_key("YOUR_API_KEY")  # free at https://xfinlink.com/signup

sectors = ["XLK", "XLF", "XLI", "XLV", "XLP", "XLU", "XLE"]
tickers = ["TLT", "SPY"] + sectors

df = xfl.prices(tickers, period="3y", fields=["adj_close"])
prices = df.pivot_table(index="date", columns="ticker", values="adj_close")[tickers].dropna()
window_returns = prices.pct_change(21, fill_method=None).dropna()

threshold = window_returns["TLT"].quantile(0.80)
rallies = window_returns["TLT"] >= threshold

result = window_returns.loc[rallies, sectors].mean().sort_values(ascending=False)
print(result)
Full script with formatting and visualisation: rate-sensitive-sector-rotation-python.py
Output
=== Rate-Sensitive Sector Rotation Screen ===
Sample: 2023-06-07 to 2026-06-04 (751 trading days)
Bond-rally definition: top 20% of 21-day TLT returns
TLT rally threshold: 2.5%
Number of bond-rally windows: 147
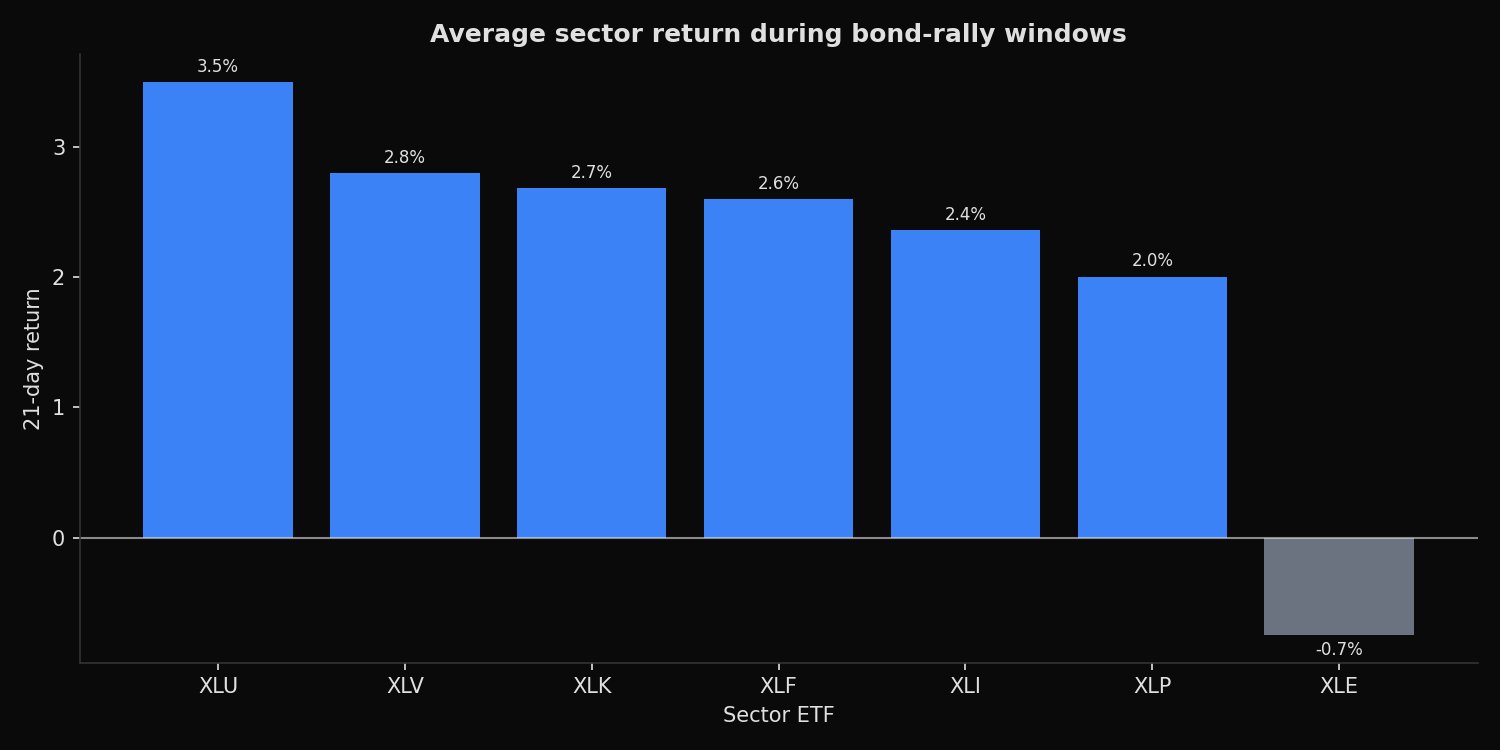
Best sector in bond rallies: XLU ( 3.5%)
Worst sector in bond rallies: XLE ( -0.7%)
Sector ranking during bond-rally windows:
XLU rally_return= 3.5% all_windows= -0.5% latest_63d_momentum= -6.3% beta_to_TLT= 0.35
XLV rally_return= 2.8% all_windows= 0.4% latest_63d_momentum= -1.2% beta_to_TLT= 0.21
XLK rally_return= 2.7% all_windows= 1.0% latest_63d_momentum= 37.8% beta_to_TLT= 0.10
XLF rally_return= 2.6% all_windows= 1.4% latest_63d_momentum= 1.9% beta_to_TLT= 0.12
XLI rally_return= 2.4% all_windows= 1.6% latest_63d_momentum= 2.4% beta_to_TLT= 0.16
XLP rally_return= 2.0% all_windows= 0.4% latest_63d_momentum= -3.9% beta_to_TLT= 0.20
XLE rally_return= -0.7% all_windows= -0.2% latest_63d_momentum= 4.0% beta_to_TLT=-0.09What this tells us
The strongest bond-rally sector is XLU, with an average 21-day return of 3.5% during top-quintile TLT rallies. XLV follows at 2.8%, and XLK is close at 2.7%. Energy is the outlier. XLE averages -0.7% during the same windows and has a negative daily beta to TLT.
The result separates rate sensitivity from simple momentum. XLK has very strong latest 63-day momentum at 37.8%, but its beta to TLT is only 0.10. XLU has poor latest momentum at -6.3%, but it has the highest bond-rally return and the highest TLT beta in the group.
That means a bond-rally rotation is not the same as buying the strongest current sector. It is a macro-conditional screen.
So what?
When long-duration bonds rally, sector allocation should be judged against the reason for the rally. If the move reflects falling discount rates without a severe growth shock, utilities, healthcare, and technology can all work. If the move reflects weaker nominal growth, energy has recently been the least attractive sector in this framework.
For tactical allocation, the screen supports a two-step rule: first identify whether TLT is in a strong 21-day rally, then rank sectors by historical behavior in those windows. The output turns a macro narrative into a repeatable rotation rule.
Built with xfinlink — free financial data API for Python. pip install xfinlink
pip install xfinlink