BLOG

Behind the numbers.

Code examples, market analysis, and data quality deep-dives.

Is AI Capex Paying Back Fast Enough? Revenue Hurdle Forecasting in Python
Could Shorter AI Asset Lives Hit Earnings? Depreciation Stress Test in Python
How Much AI Capex Risk Can a Portfolio Remove? Constrained Optimization in Python
Is the AI Capex Trade Crowded? Rolling Volatility and Sector Rotation in Python
Did the AI Boom Come From Existing S&P 500 Members? Point-in-Time Momentum Test in Python
Is AI Revenue Circular? Customer-Vendor Capex Loop Analysis in Python
Is the AI Trade Connected to Private Credit? Rolling Correlation Network in Python
Is Apollo More Balance-Sheet Sensitive Than Peers? Leverage Screen in Python
Are AI Earnings Supported by Cash Flow? Accrual and Capex Screen in Python
Can Defensive Stocks Hedge AI Drawdowns? Basket Regime Test in Python
How Fast Does the Market Price In Fed Decisions? FOMC Event Study in Python
How Much Are Options Sellers Overpaid? The Variance Risk Premium in Python
Which Companies Have the Worst Earnings Quality? Sloan Accrual Screen with Geographic Revenue Data in Python
Does the Oil-to-Gold Ratio Signal Recessions? XLE/GLD Backtest in Python
Is AI Spending Crowding Out Free Cash Flow? Capex Sustainability Across the Mag 7 in Python
Does a Long Energy / Short Bonds Portfolio Capture Inflation Surprises? Factor Construction in Python
Can a Hidden Markov Model Detect Oil Market Regimes? HMM Analysis in Python
Do Grain Prices Predict Food Inflation? Granger Causality Test in Python
Does the Corporate Credit Spread Predict Stock Market Crashes? BAA-AAA Spread Analysis in Python
Do Oil Stocks Hedge Inflation? Rolling Beta Analysis in Python
Which Stocks Are Most Rate-Sensitive? Equity Duration via Bond Beta in Python
Which Companies Have the Highest Accrual Ratios? Earnings Quality Screening in Python
Is Alpha Persistent or Decaying? Rolling Sharpe Ratio Analysis in Python
Are Markets Trending or Mean-Reverting? Hurst Exponent Analysis in Python
Is Consumer Discretionary vs Staples a Leading Indicator? XLY/XLP Ratio Analysis in Python
Does Heavy Capex Predict Future Stock Returns? Capital Expenditure Analysis in Python
How to Estimate Cost of Equity Using CAPM in Python
Is Volatility Predictable? Testing for Volatility Clustering in Python
Which Industrials Are Overleveraged? Net Debt to EBITDA Screening in Python
GM Before and After Bankruptcy: Why Entity Resolution Matters for Financial Data
What Is Adjusted Beta? Merrill Lynch Beta Shrinkage in Python
How Good Is a Stock Pick? Information Ratio and Tracking Error in Python
Do Stock Returns Follow a Normal Distribution? Testing for Fat Tails in Python
Which Large Caps Have the Highest Free Cash Flow Yield? FCF Screening in Python
Which Sectors Won Over 5 Years? Sector Rotation Analysis in Python
How to Forecast Stock Volatility with GARCH Models in Python
Are Stock Prices Mean-Reverting? Augmented Dickey-Fuller Test in Python
How to Calculate CAPM Alpha and Beta with Regression in Python
How to Compare Sector Sharpe Ratios and Sortino Ratios in Python
DELL: Why Stitching Historical Price Data Together Is Wrong
How to Analyze Drawdown and Recovery for Bank Stocks in Python
How to Screen SaaS Stocks by Revenue Growth and Cash Flow in Python
How to Screen REITs by Dividend Yield and Valuation in Python
How Correlated Are the Magnificent 7? Intra-Group Correlation in Python
AAPL vs XOM: Do Individual Stocks Have Seasonal Patterns?
How to Rank Large-Cap Stocks by Momentum in Python
How to Build a Multi-Endpoint Financial Dashboard in Python
How to Compare Volatility Across Energy Stocks in Python
How to Screen Healthcare Stocks by Valuation in Python
How to Build a Sector Correlation Matrix for Portfolio Diversification in Python
How to Find Oversold and Overbought Stocks Using Z-Scores in Python
How to Measure Earnings Quality: Cash Flow vs Net Income in Python
How to Build a Multi-Factor Stock Screen in Python (Value + Momentum + Quality)
How to Build a Simple DCF Model for Any Stock in Python
How to Screen Tech Stocks by Revenue Growth in Python
How to Screen Stocks by Balance Sheet Health in Python
Is "Sell in May" Real? SPY Monthly Seasonality Over 10 Years
How to Compare Sector Performance YTD Using Python
How to Track S&P 500 Additions and Removals Over Time in Python
How to Screen Dividend Stocks by Yield and Quality in Python
How to Calculate Max Drawdown and Recovery Time for Any Stock in Python
How to Compare Profitability Across Mega-Cap Tech Stocks in Python
Why Ticker Symbols Are Unreliable: The Recycling Problem Every Quant Should Know
How to Calculate and Compare Stock Volatility in Python
How to Screen Blue-Chip Stocks by P/E Ratio in Python
How to Track Companies Through Ticker Changes, Bankruptcies, and Renames in Python
S&P 500 Turnover: How Much the Index Has Changed Since 2010
How to Calculate Stock Beta and Correlation in Python
← All articles

Do Grain Prices Predict Food Inflation? Granger Causality Test in Python

What’s the question?

When grain commodity prices spike, food prices at the grocery store eventually follow. But how long is the lag, and is the relationship statistically causal in the Granger sense? Granger causality tests whether past values of one series improve the prediction of another beyond what the other series’ own past values provide. If grain returns at lag k improve food CPI forecasts, grain prices Granger-cause food inflation. If the reverse also holds, there is a feedback loop. If only one direction is significant, the transmission is unidirectional.

The approach

Pull the Food CPI sub-index (CPIUFDSL) from FRED and DBA (grain commodity ETF) returns from xfinlink. 10 years of monthly data. Run Granger causality in both directions at lags 1-6 months.

import xfinlink as xfl
import pandas as pd
import numpy as np
from fredapi import Fred
from statsmodels.tsa.stattools import grangercausalitytests

xfl.api_key = "YOUR_API_KEY"  # free at https://xfinlink.com/signup
fred = Fred(api_key=os.environ["FRED_API_KEY"])

# Food CPI from FRED
food_cpi = fred.get_series("CPIUFDSL", observation_start="2015-01-01")
food_mom = food_cpi.pct_change().dropna().rename("food_cpi")
food_mom.index = food_mom.index.to_period("M")

# DBA monthly returns from xfinlink
df = xfl.prices("DBA", start="2015-01-01", fields=["close"])
df["date"] = pd.to_datetime(df["date"])
monthly = df.groupby(df["date"].dt.to_period("M"))["close"].last()
grain_ret = monthly.pct_change().dropna().rename("grain_ret")

merged = pd.concat([food_mom, grain_ret], axis=1, join="inner").dropna()

# Granger causality: grain -> food CPI
gc1 = grangercausalitytests(merged[["food_cpi", "grain_ret"]], maxlag=6, verbose=False)
for lag in [1, 2, 3, 6]:
    f_stat = gc1[lag][0]["ssr_ftest"][0]
    p_val = gc1[lag][0]["ssr_ftest"][1]
    print(f"Grain->Food  Lag {lag}: F={f_stat:.2f}  p={p_val:.4f}")

# Granger causality: food CPI -> grain
gc2 = grangercausalitytests(merged[["grain_ret", "food_cpi"]], maxlag=6, verbose=False)
for lag in [1, 2, 3, 6]:
    f_stat = gc2[lag][0]["ssr_ftest"][0]
    p_val = gc2[lag][0]["ssr_ftest"][1]
    print(f"Food->Grain  Lag {lag}: F={f_stat:.2f}  p={p_val:.4f}")

Full script with formatting and visualisation: granger-grains-food-cpi-python.py

Output:

Granger causality F-statistics at lags 1 through 6 for grain prices and food CPI
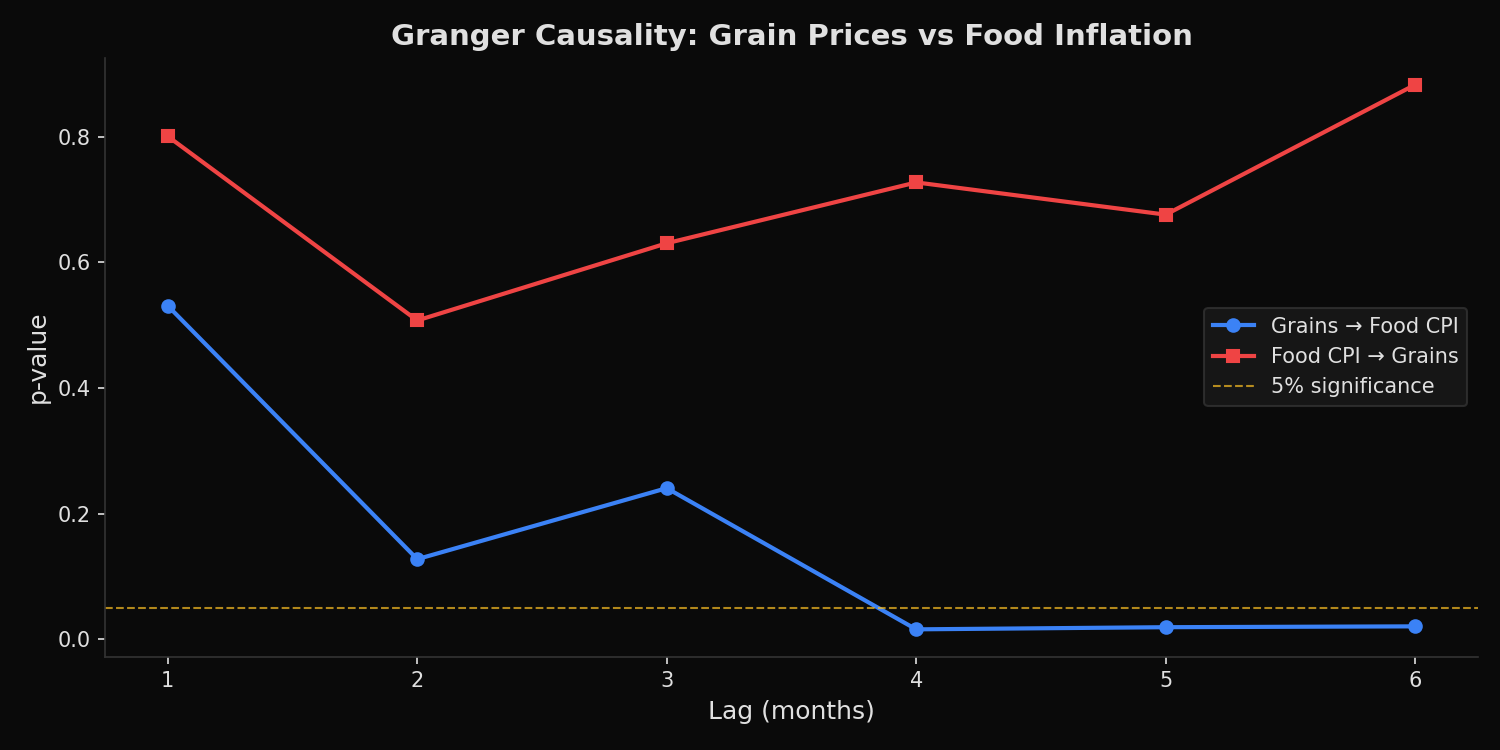
Period: 2015-02 to 2026-04 (133 months)

Test 1: Grain returns → Food CPI
  Lag 1: F=0.39  p=0.5308
  Lag 2: F=2.09  p=0.1278
  Lag 3: F=1.42  p=0.2407
  Lag 6: F=2.61  p=0.0209 *

Test 2: Food CPI → Grain returns
  Lag 1: F=0.06  p=0.8004
  Lag 2: F=0.68  p=0.5075
  Lag 3: F=0.58  p=0.6303
  Lag 6: F=0.39  p=0.8825

Result: UNIDIRECTIONAL — grain prices Granger-cause food CPI

What this tells us

Grain prices Granger-cause food CPI at lag 6 (F=2.61, p=0.021). The effect is not instantaneous — lags 1-3 are insignificant. This 6-month transmission lag reflects the time it takes for commodity price changes to flow through processing, distribution, and retail pricing. Food CPI does not Granger-cause grain returns at any lag (all p > 0.50), confirming the causal direction runs from commodities to consumer prices, not the reverse. This is consistent with a supply-chain cost-push model.

So what?

For inflation forecasting, a 6-month spike in grain commodity prices is a leading indicator of food CPI acceleration. Central bank watchers and macro traders can use this lag to anticipate food inflation prints. The unidirectional finding also has portfolio implications: grain commodity exposure (via DBA or futures) provides a structural lead over food inflation, making it useful for inflation-hedging strategies that need to be positioned before CPI data confirms the trend.

Built with xfinlink — free financial data API for Python. pip install xfinlink
← All articles