BLOG

Behind the numbers.

Code examples, market analysis, and data quality deep-dives.

Is AI Capex Paying Back Fast Enough? Revenue Hurdle Forecasting in Python
Could Shorter AI Asset Lives Hit Earnings? Depreciation Stress Test in Python
How Much AI Capex Risk Can a Portfolio Remove? Constrained Optimization in Python
Is the AI Capex Trade Crowded? Rolling Volatility and Sector Rotation in Python
Did the AI Boom Come From Existing S&P 500 Members? Point-in-Time Momentum Test in Python
Is AI Revenue Circular? Customer-Vendor Capex Loop Analysis in Python
Is the AI Trade Connected to Private Credit? Rolling Correlation Network in Python
Is Apollo More Balance-Sheet Sensitive Than Peers? Leverage Screen in Python
Are AI Earnings Supported by Cash Flow? Accrual and Capex Screen in Python
Can Defensive Stocks Hedge AI Drawdowns? Basket Regime Test in Python
How Fast Does the Market Price In Fed Decisions? FOMC Event Study in Python
How Much Are Options Sellers Overpaid? The Variance Risk Premium in Python
Which Companies Have the Worst Earnings Quality? Sloan Accrual Screen with Geographic Revenue Data in Python
Does the Oil-to-Gold Ratio Signal Recessions? XLE/GLD Backtest in Python
Is AI Spending Crowding Out Free Cash Flow? Capex Sustainability Across the Mag 7 in Python
Does a Long Energy / Short Bonds Portfolio Capture Inflation Surprises? Factor Construction in Python
Can a Hidden Markov Model Detect Oil Market Regimes? HMM Analysis in Python
Do Grain Prices Predict Food Inflation? Granger Causality Test in Python
Does the Corporate Credit Spread Predict Stock Market Crashes? BAA-AAA Spread Analysis in Python
Do Oil Stocks Hedge Inflation? Rolling Beta Analysis in Python
Which Stocks Are Most Rate-Sensitive? Equity Duration via Bond Beta in Python
Which Companies Have the Highest Accrual Ratios? Earnings Quality Screening in Python
Is Alpha Persistent or Decaying? Rolling Sharpe Ratio Analysis in Python
Are Markets Trending or Mean-Reverting? Hurst Exponent Analysis in Python
Is Consumer Discretionary vs Staples a Leading Indicator? XLY/XLP Ratio Analysis in Python
Does Heavy Capex Predict Future Stock Returns? Capital Expenditure Analysis in Python
How to Estimate Cost of Equity Using CAPM in Python
Is Volatility Predictable? Testing for Volatility Clustering in Python
Which Industrials Are Overleveraged? Net Debt to EBITDA Screening in Python
GM Before and After Bankruptcy: Why Entity Resolution Matters for Financial Data
What Is Adjusted Beta? Merrill Lynch Beta Shrinkage in Python
How Good Is a Stock Pick? Information Ratio and Tracking Error in Python
Do Stock Returns Follow a Normal Distribution? Testing for Fat Tails in Python
Which Large Caps Have the Highest Free Cash Flow Yield? FCF Screening in Python
Which Sectors Won Over 5 Years? Sector Rotation Analysis in Python
How to Forecast Stock Volatility with GARCH Models in Python
Are Stock Prices Mean-Reverting? Augmented Dickey-Fuller Test in Python
How to Calculate CAPM Alpha and Beta with Regression in Python
How to Compare Sector Sharpe Ratios and Sortino Ratios in Python
DELL: Why Stitching Historical Price Data Together Is Wrong
How to Analyze Drawdown and Recovery for Bank Stocks in Python
How to Screen SaaS Stocks by Revenue Growth and Cash Flow in Python
How to Screen REITs by Dividend Yield and Valuation in Python
How Correlated Are the Magnificent 7? Intra-Group Correlation in Python
AAPL vs XOM: Do Individual Stocks Have Seasonal Patterns?
How to Rank Large-Cap Stocks by Momentum in Python
How to Build a Multi-Endpoint Financial Dashboard in Python
How to Compare Volatility Across Energy Stocks in Python
How to Screen Healthcare Stocks by Valuation in Python
How to Build a Sector Correlation Matrix for Portfolio Diversification in Python
How to Find Oversold and Overbought Stocks Using Z-Scores in Python
How to Measure Earnings Quality: Cash Flow vs Net Income in Python
How to Build a Multi-Factor Stock Screen in Python (Value + Momentum + Quality)
How to Build a Simple DCF Model for Any Stock in Python
How to Screen Tech Stocks by Revenue Growth in Python
How to Screen Stocks by Balance Sheet Health in Python
Is "Sell in May" Real? SPY Monthly Seasonality Over 10 Years
How to Compare Sector Performance YTD Using Python
How to Track S&P 500 Additions and Removals Over Time in Python
How to Screen Dividend Stocks by Yield and Quality in Python
How to Calculate Max Drawdown and Recovery Time for Any Stock in Python
How to Compare Profitability Across Mega-Cap Tech Stocks in Python
Why Ticker Symbols Are Unreliable: The Recycling Problem Every Quant Should Know
How to Calculate and Compare Stock Volatility in Python
How to Screen Blue-Chip Stocks by P/E Ratio in Python
How to Track Companies Through Ticker Changes, Bankruptcies, and Renames in Python
S&P 500 Turnover: How Much the Index Has Changed Since 2010
How to Calculate Stock Beta and Correlation in Python
← All articles

Is Apollo More Balance-Sheet Sensitive Than Peers? Leverage Screen in Python

What's the question?

Apollo is often grouped with alternative asset managers such as Blackstone, KKR, Ares, Blue Owl, and traditional public asset managers. That comparison can be misleading if one company carries a much larger balance sheet relative to equity. A fee-light asset manager earns management and performance fees on third-party assets. A balance-sheet-intensive financial company is more exposed to asset values, liabilities, funding costs, and capital rules.

This distinction matters in debates about private credit and reinsurance. Insurance and reinsurance structures can make an asset manager look less like a pure fee business and more like a financial balance sheet. Public filings cannot settle every structural question, but they can show whether Apollo's public company financials are unusually asset-heavy compared with peers.

The approach

The screen compares APO, KKR, BX, BLK, ARES, OWL, BEN, and TROW. The core metric is total assets divided by total equity. This is not a regulatory capital ratio. It is a simple accounting leverage measure: how many dollars of assets sit on the balance sheet for each dollar of book equity.

The analysis also computes revenue-to-assets and operating-cash-flow-to-assets. These measures show how efficiently the asset base produces revenue and cash flow. A high asset multiple with low cash flow productivity is more sensitive to asset marks and financing conditions than a low asset multiple with high cash flow productivity.

Code

import xfinlink as xfl
import pandas as pd

xfl.set_api_key("YOUR_API_KEY")  # free at https://xfinlink.com/signup

tickers = ["APO", "KKR", "BX", "BLK", "ARES", "OWL", "BEN", "TROW"]
fields = ["revenue", "net_income", "operating_cash_flow",
          "total_assets", "total_equity"]

df = xfl.fundamentals(tickers, period_type="annual", period="3y", fields=fields)
latest = df.sort_values("period_end").groupby("ticker").tail(1).copy()

latest["assets_to_equity"] = latest["total_assets"] / latest["total_equity"]
latest["revenue_to_assets"] = latest["revenue"] / latest["total_assets"]
latest["ocf_to_assets"] = latest["operating_cash_flow"] / latest["total_assets"]

print(latest.sort_values("assets_to_equity", ascending=False)[
    ["ticker", "assets_to_equity", "revenue_to_assets", "ocf_to_assets"]
])

Full script with formatting and visualisation: apollo-peer-balance-sheet-risk-python.py

Output

Apollo balance-sheet intensity compared with alternative asset manager peers
=== Asset-Manager Balance-Sheet Sensitivity Screen ===
Latest annual period per company (max period_end 2025-12-31)

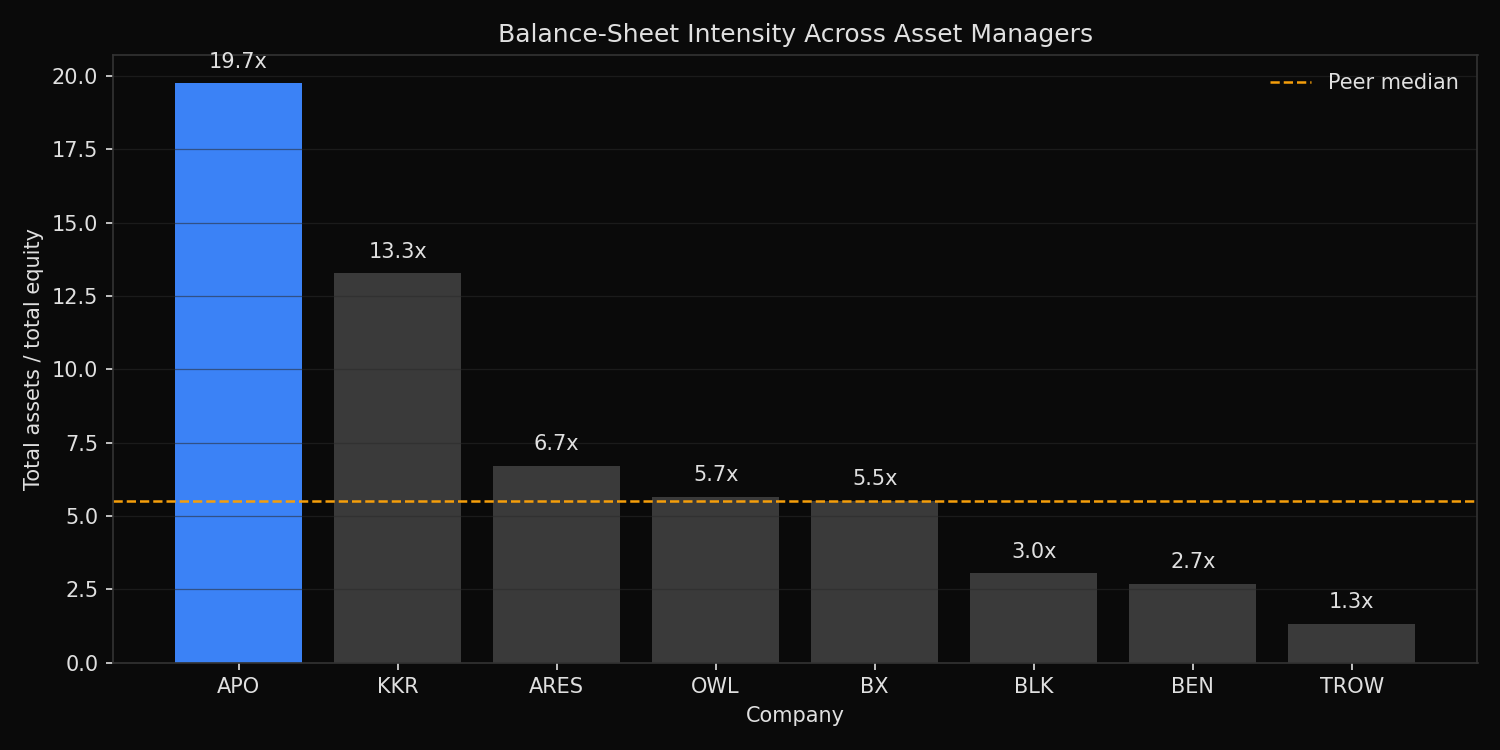
APO assets/equity: 19.7x
Peer median assets/equity: 5.5x
APO multiple vs peer median: 3.6x

Balance-sheet ranking:
APO   assets=$  460.9B  equity=$  23.3B  assets/equity= 19.7x  revenue/assets= 7.0%  OCF/assets= 1.6%
KKR   assets=$  410.1B  equity=$  30.9B  assets/equity= 13.3x  revenue/assets= 4.7%  OCF/assets= 0.1%
ARES  assets=$   28.6B  equity=$   4.3B  assets/equity=  6.7x  revenue/assets=19.6%  OCF/assets=11.4%
OWL   assets=$   12.5B  equity=$   2.2B  assets/equity=  5.7x  revenue/assets=23.0%  OCF/assets=10.1%
BX    assets=$   47.7B  equity=$   8.7B  assets/equity=  5.5x  revenue/assets=30.3%  OCF/assets= 9.8%
BLK   assets=$  170.0B  equity=$  55.9B  assets/equity=  3.0x  revenue/assets=14.2%  OCF/assets= 2.3%
BEN   assets=$   32.4B  equity=$  12.1B  assets/equity=  2.7x  revenue/assets=27.1%  OCF/assets= 3.3%
TROW  assets=$   14.3B  equity=$  10.9B  assets/equity=  1.3x  revenue/assets=51.0%  OCF/assets=12.2%

What this tells us

Apollo is materially more balance-sheet intensive than the median peer in this sample. APO reports $460.9B of total assets against $23.3B of equity, an assets-to-equity multiple of 19.7x. The peer median is 5.5x. Apollo's multiple is 3.6 times the peer median.

KKR is also balance-sheet intensive at 13.3x, so Apollo is not the only asset-heavy alternative manager. The contrast is clearest against TROW, BEN, BLK, and BX. TROW has only 1.3x assets to equity and produces revenue equal to 51.0% of assets. Apollo produces revenue equal to 7.0% of assets and operating cash flow equal to 1.6% of assets.

This does not prove that Apollo's asset quality is weak. It does show that Apollo should not be analyzed as a simple fee manager. A large asset base means changes in credit spreads, asset marks, insurance liabilities, and funding costs can matter more than they would for a lighter asset manager.

So what?

The reinsurance and private-credit debate should start with balance-sheet classification. If Apollo is treated as a fee-light manager, the risk model understates its sensitivity to assets and liabilities. If it is treated as a balance-sheet financial company with an asset-management overlay, the risk model is more realistic.

For portfolio construction, this changes peer grouping. APO belongs in a stress test with KKR and other balance-sheet-sensitive financials, not only with traditional asset managers. The most useful next step is to track asset growth, equity growth, and operating cash flow together. A rising assets-to-equity multiple without improving cash flow productivity would be the warning sign.

Built with xfinlink — free financial data API for Python. pip install xfinlink

Built with xfinlink — free financial data API for Python. pip install xfinlink
← All articles