
Does the Corporate Credit Spread Predict Stock Market Crashes? BAA-AAA Spread Analysis in Python
May 19, 2026
What’s the question?
Corporate credit spreads — the difference in yield between lower-quality (BAA) and higher-quality (AAA) bonds — reflect the market’s assessment of default risk. When spreads widen, the bond market is pricing in greater probability of corporate distress. If the bond market leads the equity market, widening spreads should predict larger subsequent stock market drawdowns. This has direct implications for risk management: credit spreads could serve as an early warning system.
The approach
Pull BAA and AAA yields from FRED (Moody’s seasoned corporate bond yields), SPY from xfinlink. 10 years of data. Compute spread z-score (252-day rolling), forward 3-month max drawdown, sort into quintiles.
import xfinlink as xfl
import pandas as pd
import numpy as np
from fredapi import Fred

xfl.api_key = "YOUR_API_KEY"  # free at https://xfinlink.com/signup
fred = Fred(api_key=os.environ["FRED_API_KEY"])

# Credit spreads from FRED
baa = fred.get_series("BAA", observation_start="2016-01-01").rename("baa")
aaa = fred.get_series("AAA", observation_start="2016-01-01").rename("aaa")
spreads = pd.concat([baa, aaa], axis=1).dropna()
spreads["spread"] = spreads["baa"] - spreads["aaa"]

# SPY prices
spy = xfl.prices("SPY", start="2016-01-01", fields=["close"])
spy["date"] = pd.to_datetime(spy["date"])
spy = spy.set_index("date")["close"]

# Merge and compute z-score
merged = pd.concat([spreads["spread"], spy], axis=1).ffill().dropna()
merged["z"] = (merged["spread"] - merged["spread"].rolling(252).mean()) / merged["spread"].rolling(252).std()

# Forward 3-month max drawdown
fwd_dd = []
close_vals = merged["close"].values
for i in range(len(close_vals)):
    if i + 63 < len(close_vals):
        window = close_vals[i : i + 63]
        fwd_dd.append(window.min() / window[0] - 1)
    else:
        fwd_dd.append(np.nan)
merged["fwd_dd"] = fwd_dd

analysis = merged.dropna(subset=["z", "fwd_dd"]).copy()
analysis["quintile"] = pd.qcut(analysis["z"], 5, labels=["Q1 (Tight)", "Q2", "Q3", "Q4", "Q5 (Wide)"])
print(analysis.groupby("quintile")["fwd_dd"].agg(["mean", "median", "count"]))
Full script with formatting and visualisation: credit-spread-drawdown-signal-python.py
Output:
=== BAA-AAA Credit Spread vs Forward 3-Month SPY Max Drawdown ===
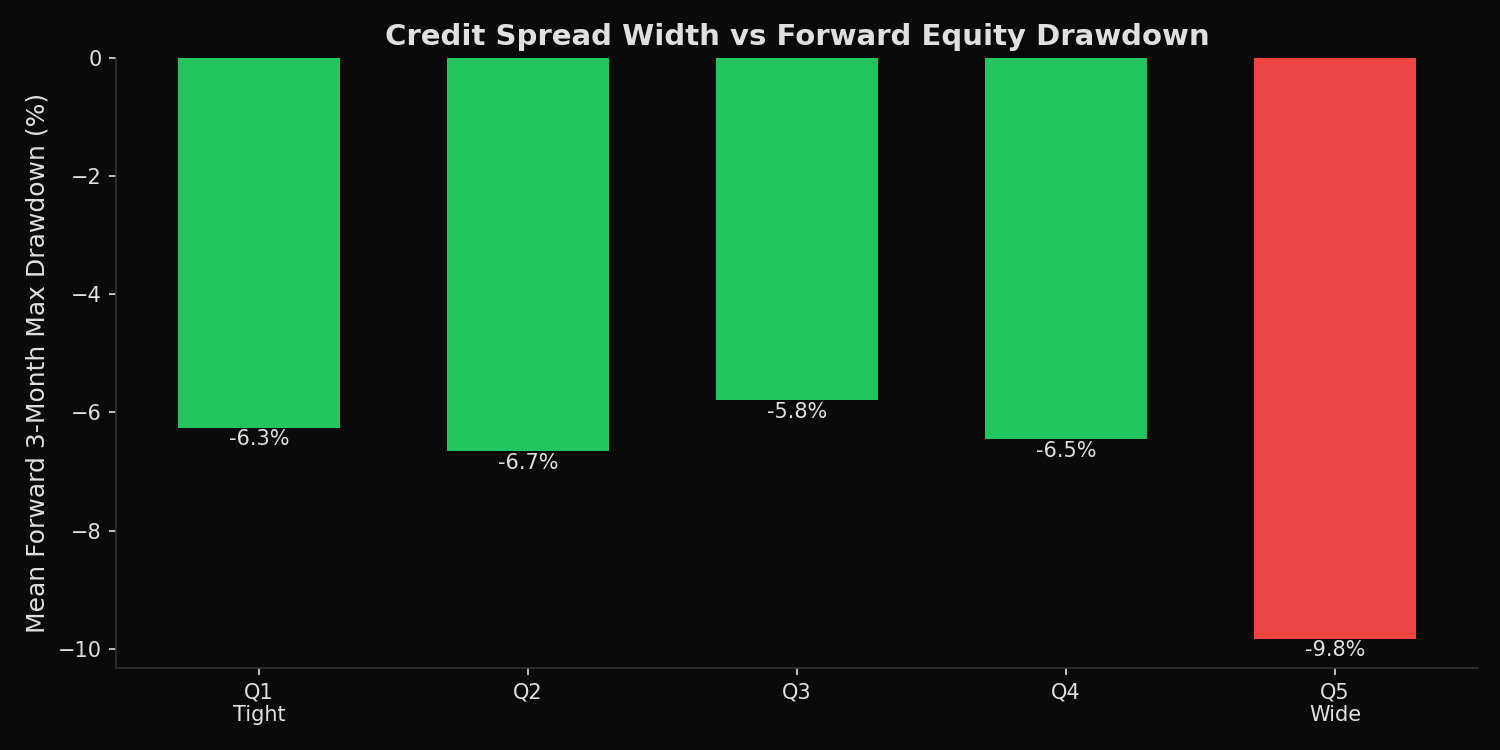
Q1 (Tight) mean_dd=-6.3% median_dd=-4.1% n=503
Q2 mean_dd=-6.7% median_dd=-4.1% n=503
Q3 mean_dd=-5.8% median_dd=-5.1% n=502
Q4 mean_dd=-6.5% median_dd=-6.6% n=503
Q5 (Wide) mean_dd=-9.8% median_dd=-9.1% n=503
Current spread: 0.61% z-score: -0.23What this tells us
The widest spread quintile (Q5) experiences forward 3-month drawdowns of -9.8% on average — 55% worse than the -6.3% for tight spreads (Q1). The median confirms this is not driven by outliers: Q5 median is -9.1% vs Q1 median of -4.1%. The relationship is monotonic in the tail — Q5 is distinctly worse than Q1-Q4, which cluster around -5.8% to -6.7%. The bond market does appear to lead equity risk, but only at extremes. Current spread z-score of -0.23 places the market in the benign Q2-Q3 range.
So what?
Monitor the BAA-AAA spread z-score as a risk overlay. When it exceeds +1.5 (well into Q5), tighten equity risk limits or increase cash allocation — the bond market is pricing in stress that equity markets have not yet reflected. Below +1.0, the signal is too noisy to be actionable. This is not a timing signal for entry or exit — it is a risk management signal for position sizing.
pip install xfinlink