
Which Part of a 13F Is Worth Copying? Top Holdings Against New Buys in Python
September 17, 2026
What’s the question?
Any institution managing more than $100 million in US-listed equities files a Form 13F within 45 days of each quarter end, listing every position held on the last day of the quarter. The filings are free, and an industry sits on top of them: funds and newsletters that rebuild a famous manager’s book and sell the copy.
Copying the whole book is rare. Cloners take a slice, and two slices draw the attention. The largest positions are one, on the reasoning that judgement shows up where the money is; Cohen, Polk and Silli found support for that in mutual fund holdings, where the most heavily weighted positions beat the rest of the same portfolios by 1 to 2.5 points a quarter. The newly opened positions are the other, taken as current thinking rather than a legacy holding. Both slices can be tested on filings that could actually have been traded.
The approach
Fifteen managers that select stocks rather than track an index, long-only houses and hedge funds both, named in the output below. Built from SEC EDGAR public filings and market data.
- Read each manager’s book at every quarter end from March 2013 to June 2024, summing reported value by issuer so a company held through two share classes counts once.
- Rank each book by position value and cut three portfolios: the ten largest, positions eleven to fifty, and every position the manager did not report a quarter earlier.
- Buy each portfolio at the end of the month the 45-day deadline falls in, two months after the quarter end, so nothing trades on a holding list before it is public. Hold one quarter, weight equally.
- Average the three returns across managers each quarter, giving 46 non-overlapping observations, and compare them with SPY and with the equal-weighted S&P 500 fund RSP over identical windows. All returns include dividends.
Two limits belong in the reading. A Form 13F shows long positions in US-listed securities, so short books, foreign listings and cash never appear, and none of these portfolios is a manager’s actual return. The firms were chosen in 2026, knowing which survived, and that favours the managers. A position that stops pricing mid-window is carried to its last observed month.
Code
import pandas as pd
import xfinlink as xfl
from scipy import stats

xfl.set_api_key("YOUR_API_KEY")  # free at https://xfinlink.com/signup

MANAGERS = {146: "Dodge & Cox", 3481: "Capital Research Global", 58: "Berkshire Hathaway",
            9349: "Lone Pine Capital", 1608: "Baupost Group", 505: "Third Point"}  # 15 in full

bk = pd.concat([xfl.manager_holdings(mid, start="2012-10-01", end="2024-06-30")
                  .assign(manager_name=nm) for mid, nm in MANAGERS.items()], ignore_index=True)
bk["q"] = bk["report_date"].dt.to_period("Q")

pos = bk.groupby(["manager_name", "q", "entity_id"], as_index=False)["value_usd"].sum()
pos["rank"] = pos.groupby(["manager_name", "q"])["value_usd"].rank(ascending=False, method="first")
held = {k: set(g["entity_id"]) for k, g in pos.groupby(["manager_name", "q"])}
pos["is_new"] = [(e not in held[(m, q - 1)]) if (m, q - 1) in held else False
                 for m, q, e in zip(pos["manager_name"], pos["q"], pos["entity_id"])]

rows = []
for q in sorted(pos["q"].unique()):
    m0 = q.asfreq("M", "end") + 2                   # month the 45-day deadline falls in
    book = pos[(pos["q"] == q) & ((pos["rank"] <= 50) | pos["is_new"])]
    px = xfl.prices(entity_id=sorted(book["entity_id"].unique()),
                    start=str((m0 + 1).start_time.date()), end=str((m0 + 3).end_time.date()),
                    interval="1mo", fields=["return_daily"])
    fwd = px.groupby("entity_id")["return_daily"].apply(lambda r: (1 + r).prod() - 1)
    for mgr, g in book.groupby("manager_name"):
        pick = lambda mask: fwd.reindex(g.loc[mask, "entity_id"]).dropna().mean()
        rows.append(dict(manager=mgr, q=q,
                         top=pick(g["rank"] <= 10),
                         nxt=pick((g["rank"] > 10) & (g["rank"] <= 50)),
                         new=pick(g["is_new"])))

qtr = pd.DataFrame(rows).groupby("q")[["top", "nxt", "new"]].mean()
spread = qtr["top"] - qtr["nxt"]
print(spread.mean(), stats.ttest_1samp(spread, 0.0))
Full script with formatting and visualisation: 13f-top-holdings-vs-new-buys-python.py
Output
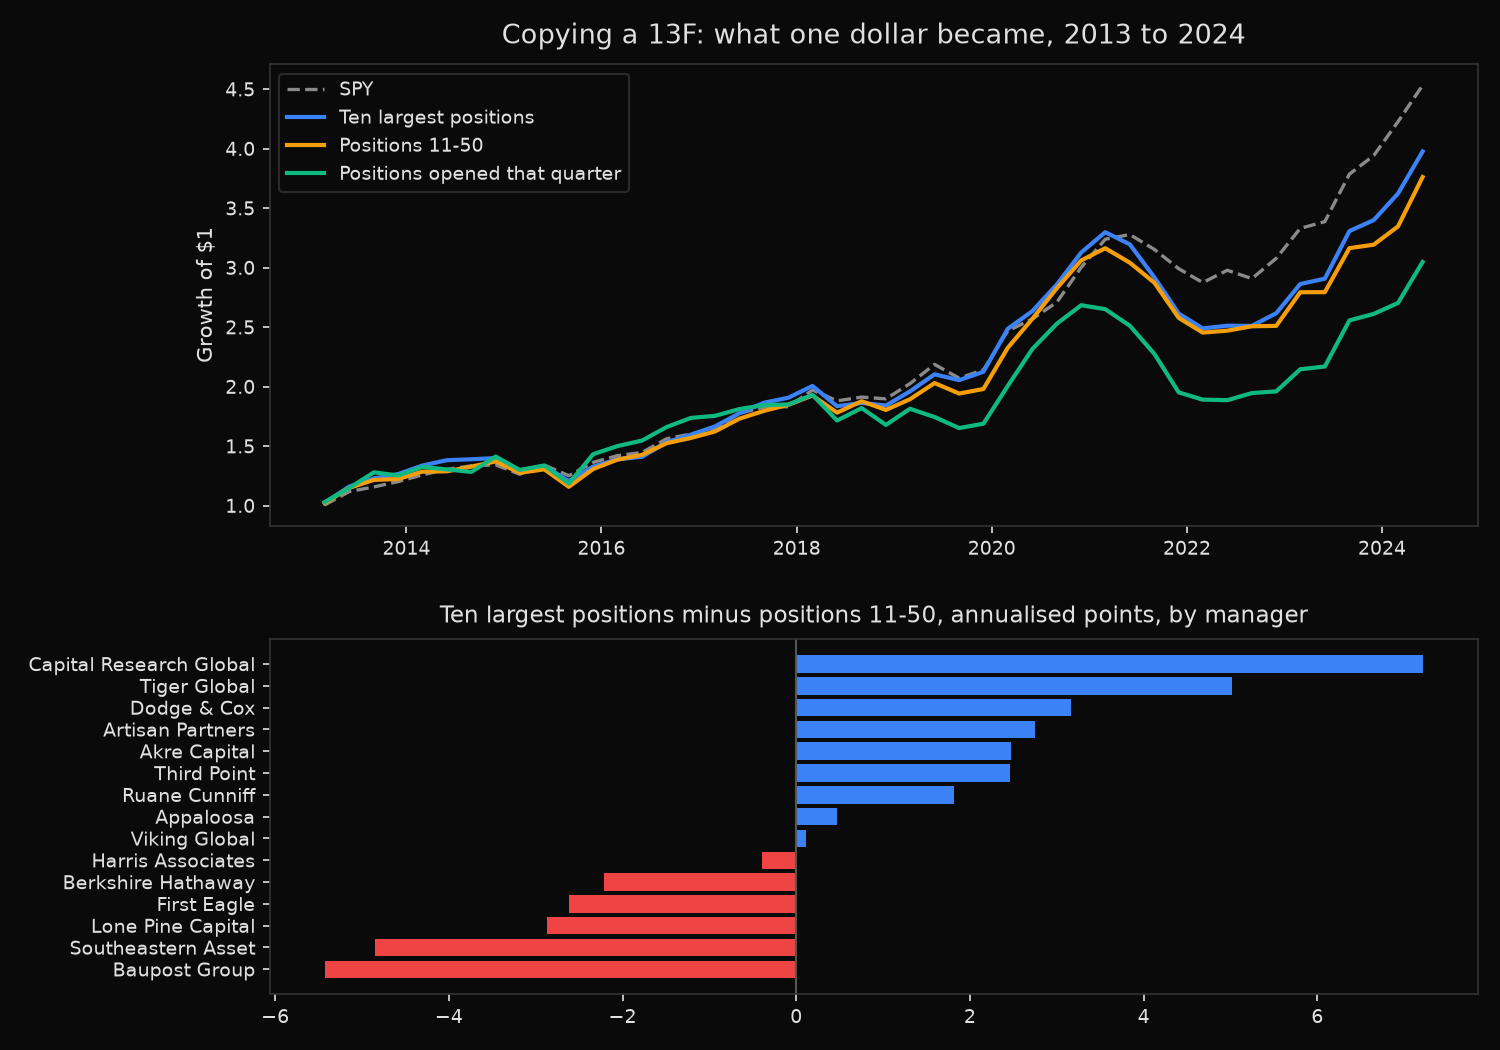
Form 13F books, 15 managers, 2013Q1 to 2024Q2 (46 quarter ends)
Book rows read: 79,081   manager-quarters used: 684   below the depth screen: 6
Holding windows: 2013-06 to 2024-11   positions priced: 27,965   unpriced: 288
Positions per manager-quarter: top 9.9, next 31.0, new 11.0
Quarters with a complete return for every portfolio: 46 of 46   dates ordered: True
SPY quarterly window range: -6.69% to +15.29%

Equal-weighted, rebuilt every quarter, held one quarter

portfolio                         mean qtr    CAGR  $1 grew to   vs SPY      t       p
Ten largest positions                3.22%  12.75%       3.98x   -1.29  -0.75   0.455
Positions 11-50                      3.11%  12.21%       3.76x   -1.83  -0.78   0.441
Positions opened that quarter        2.75%  10.18%       3.05x   -3.87  -0.91   0.369
SPY                                  3.46%  14.04%       4.53x

Ten largest minus positions 11-50: +0.11 pts per quarter (median +0.39), t=0.39, p=0.696
  positive in 29 of 46 quarters (sign test p=0.104), worst -4.5 pts in 2020Q2

New positions minus positions 11-50: -0.36 pts per quarter (median -0.47), t=-0.75, p=0.459
  positive in 22 of 46 quarters (sign test p=0.883), worst -11.0 pts in 2019Q2

Against an equal-weighted index fund, 2018Q1 to 2024Q2 (26 quarters), CAGR
  Ten largest positions             11.97%
  Positions 11-50                   11.56%
  Positions opened that quarter      7.98%
  RSP, equal weight                 11.94%
  SPY, capitalisation weight        14.96%

Per manager, annualised: ten largest against positions 11-50 (9 of 15 positive)

manager                     qtrs   top 10    11-50   spread
Capital Research Global       46   20.14%   12.93%   +7.21
Tiger Global                  46   17.51%   12.49%   +5.02
Dodge & Cox                   46   15.34%   12.18%   +3.16
Artisan Partners              46   15.98%   13.22%   +2.75
Akre Capital                  45   15.86%   13.39%   +2.47
Third Point                   46   13.91%   11.44%   +2.47
Ruane Cunniff                 46   16.79%   14.98%   +1.81
Appaloosa                     46   15.40%   14.93%   +0.47
Viking Global                 46   14.30%   14.19%   +0.11
Harris Associates             46   14.41%   14.81%   -0.40
Berkshire Hathaway            46    8.97%   11.19%   -2.22
First Eagle                   46   10.23%   12.85%   -2.62
Lone Pine Capital             46   13.53%   16.39%   -2.87
Southeastern Asset            46    8.17%   13.03%   -4.86
Baupost Group                 41   -0.29%    5.14%   -5.43
What this tells us
The ordering came out as the theory predicts and the magnitude did not. The ten largest positions compounded at 12.75% a year, positions eleven to fifty at 12.21%, positions opened that quarter at 10.18%. Half a point a year separates conviction from the rest of the book, 0.11 points a quarter with a t-statistic of 0.39, which across 46 quarters cannot be told apart from zero.
The sign is steadier than the average. The ten largest beat the rest of the book in 29 of the 46 quarters, a frequency a fair coin produces about 10% of the time, and the median gap of +0.39 points a quarter is more than three times the mean. Conviction won small and often, then lost large: the worst window, opening September 2020, cost 4.5 points in three months. It won far less than the best-ideas research reports, which rank by weight relative to a benchmark rather than by raw size.
New positions finished last, trailing positions eleven to fifty by 0.36 points a quarter and SPY by 3.87 points a year. A position just opened is the one a manager has committed least to, and it is disclosed six weeks after the buying.
Against SPY every portfolio trails; against RSP, the equal-weighted version of the same index, none of them does. Over the 26 quarters where both run, the ten largest positions returned 11.97% a year and RSP 11.94%, against 14.96% for SPY. These portfolios hold ten to fifty names in equal size, SPY holds five hundred in proportion to market value, and that weighting decision was worth roughly three points a year on its own. Dispersion across the fifteen firms is wide too, from +7.21 points a year to -5.43.
So what?
Copy the top of the book rather than the new names. The new-buy list, the part of a filing that attracts the most coverage, was the weakest portfolio of the three, and a new position is better read as a starter than as a signal.
Choose the benchmark first, because it settles the answer. Judged against SPY, a 13F clone looks like a failure costing between one and four points a year; judged against an equal-weighted index fund, the same portfolios are level to within a rounding error.
The conviction gap itself, half a point a year with a t-statistic of 0.39, will not support a performance fee. If the reason to clone is cheap access to a concentrated portfolio that no index provides, the filings deliver it; if the reason is an expected edge over the S&P 500, 46 quarters of evidence do not.
Built with xfinlink — free financial data API for Python. pip install -U xfinlink
pip install -U xfinlink