
How Concentrated Are S&P 500 Earnings? Point-in-Time Index Analysis in Python
August 2, 2026
What's the question?
Concentration in the S&P 500 is normally discussed in terms of market value, and the ten largest members now carry roughly a third of the index weight. Market value is a price, though, and a price is an opinion about future profits that can be revised overnight.
Reported profit is different. It arrives in an audited annual filing and cannot be revised by sentiment. So the question is whether the profit behind the index has concentrated as fast as the price. If the ten largest earners still produce the share of aggregate profit they produced in 2010, rising index concentration is a valuation phenomenon and should mean-revert like one. If their share has climbed too, the concentration is structural.
Two measures answer this: the top-ten share of the profit pool, being the sum of positive net income across members, and the effective number of companies, the reciprocal of the Herfindahl index of profit shares. The second reports how many equally sized earners would produce the observed concentration.
The approach
Any comparison across sixteen years falls apart if the roster is wrong. Today’s membership list is a list of survivors, and survivors were disproportionately profitable, so backdating it decides the answer in advance.
- Pull S&P 500 membership at each 31 December from 2010 to 2025, keyed to entity identifiers rather than tickers. A ticker is a lease rather than a name: S, PX and SLE carried Sprint, Praxair and Sara Lee in 2010 and carry SentinelOne, P10 and Super League Enterprise today.
- Pull one annual income statement per member per roster. Fiscal year Y covers period ends from June of Y to May of Y+1, which places Microsoft’s June year end and Walmart’s January year end in the year they describe.
- Screen the panel. A member without both figures for that fiscal year, or without positive revenue, leaves that year’s sample. Where a fiscal-year change yields two statements inside one window, the later is kept.
- Compute both measures for revenue and for net income separately, since revenue is a scale measure and profit a margin measure, then recompute fiscal 2010 using today’s roster to size what survivorship bias does here.
Coverage runs from 467 of 486 members in fiscal 2010 to 485 of 496 in fiscal 2025.
Code
import numpy as np
import pandas as pd
import xfinlink as xfl

xfl.set_api_key("YOUR_API_KEY")  # free at https://xfinlink.com/signup

def roster(as_of):
    df = xfl.index("sp500", as_of=as_of).dropna(subset=["entity_id"])
    return sorted(set(df["entity_id"].astype(int)))

def fiscal_year(ids, year):
    frames = [xfl.fundamentals(entity_id=ids[i:i + 100], period_type="annual",
                               start=f"{year}-06-01", end=f"{year + 1}-05-31",
                               fields=["revenue", "net_income"], max_rows=100000)
              for i in range(0, len(ids), 100)]
    f = pd.concat([x for x in frames if len(x)], ignore_index=True)
    f = f.dropna(subset=["revenue", "net_income"])
    f = f[f["revenue"] > 0]
    return f.sort_values("period_end").groupby("entity_id", as_index=False).tail(1)

def concentration(values):
    pos = np.sort(np.asarray(values, dtype=float)[np.asarray(values) > 0])[::-1]
    w = pos / pos.sum()
    return 100 * w[:10].sum(), 1.0 / np.sum(w ** 2)

for year in range(2010, 2026):
    f = fiscal_year(roster(f"{year}-12-31"), year)
    rev_top10, rev_neff = concentration(f["revenue"])
    ni_top10, ni_neff = concentration(f["net_income"])
    print(f"{year}  revenue {rev_top10:.1f}% / {rev_neff:.1f}   "
          f"profit {ni_top10:.1f}% / {ni_neff:.1f}")
Full script with formatting and visualisation: sp500-earnings-concentration-point-in-time-python.py
Output
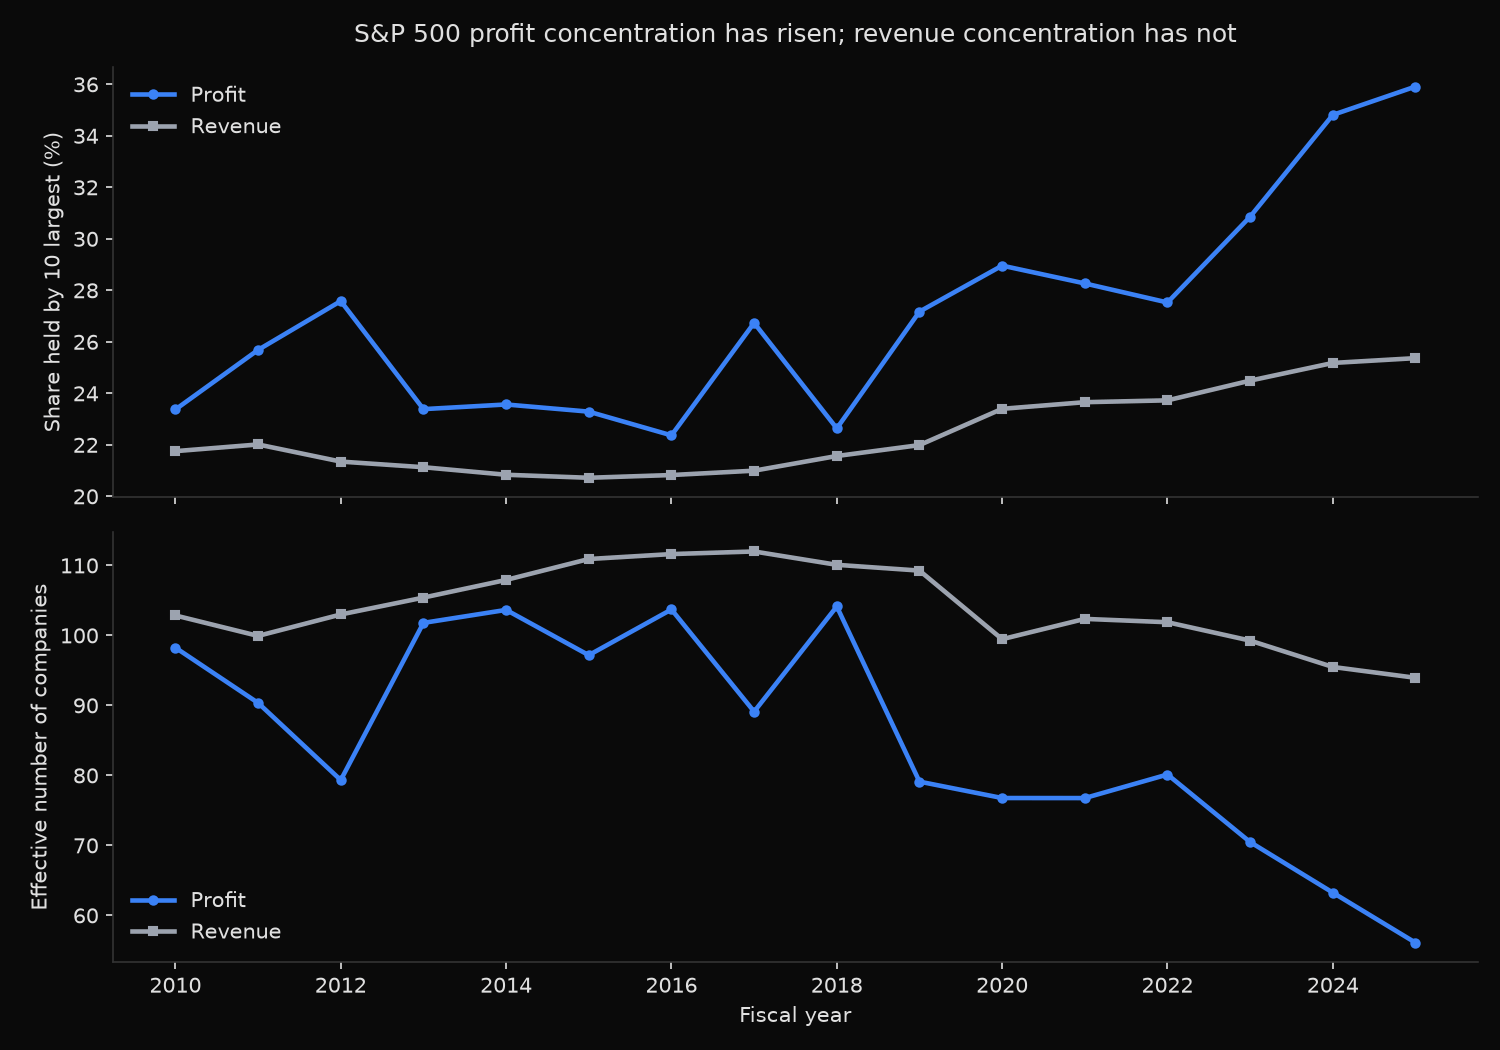
S&P 500 earnings vs revenue concentration, point-in-time rosters
FY    members  covered  rev top10  rev Neff  NI top10  NI Neff  profit pool  loss-makers
2010      486      467      21.8%     102.9     23.4%     98.3         757b           25
2011      488      468      22.0%      99.9     25.7%     90.4         862b           27
2012      491      470      21.3%     103.0     27.6%     79.3         845b           36
2013      491      470      21.1%     105.4     23.4%    101.8         979b           18
2014      492      469      20.8%     107.9     23.6%    103.6         959b           20
2015      495      475      20.7%     110.9     23.3%     97.2         972b           41
2016      496      483      20.8%     111.6     22.4%    103.7         987b           47
2017      498      486      21.0%     112.0     26.7%     89.1       1,080b           42
2018      499      490      21.6%     110.1     22.6%    104.1       1,213b           28
2019      500      493      22.0%     109.3     27.2%     79.1       1,301b           33
2020      500      493      23.4%      99.5     29.0%     76.8       1,107b           79
2021      500      494      23.7%     102.4     28.3%     76.8       1,840b           20
2022      499      497      23.7%     101.9     27.5%     80.1       1,688b           40
2023      499      499      24.5%      99.3     30.9%     70.5       1,813b           32
2024      499      495      25.2%      95.5     34.8%     63.3       1,966b           24
2025      496      485      25.4%      93.9     35.9%     56.1       2,193b           26

Top 10 earners, FY2010 vs FY2025 ($m)
#  FY2010      net income   FY2025      net income
1  XOM             30,460   GOOGL          132,170
2  T               19,864   NVDA           120,067
3  CVX             19,024   AAPL           112,010
4  MSFT            18,760   MSFT           101,832
5  JPM             17,370   AMZN            77,670
6  WMT             16,389   BRK             66,968
7  IBM             14,833   META            60,458
8  AAPL            14,013   JPM             57,048
9  JNJ             13,334   BAC             30,509
10 BRK             12,967   XOM             28,844

FY2010 measured two ways
point-in-time 2010 roster : 467 names, top-10 share 23.4%, Neff 98.3
today's roster backdated  : 456 names, top-10 share 24.5%, Neff 88.2
What this tells us
Revenue barely moved. The ten largest sellers took 21.8 percent of index revenue in fiscal 2010 and 25.4 percent in fiscal 2025, and the effective number of revenue generators fell only from 102.9 to 93.9. Profit moved a long way: the top-ten share went from 23.4 percent to 35.9 percent and the effective count fell from 98.3 to 56.1, a decline of 43 percent. Since the revenue base did not concentrate, the gap is margin. Alphabet converted 32.8 percent of its fiscal 2025 revenue into net income and NVIDIA converted 55.6 percent, against 10.8 percent at Amazon, the largest seller in the index.
Net income absorbs impairments, settlements and tax charges, so the profit series is noisy, and the effective count swings between 76 and 104 through the middle of the decade without trending. What follows fiscal 2022 differs in kind: three consecutive falls, from 80.1 to 70.5 to 63.3 to 56.1, with no reversal.
Measuring fiscal 2010 with today’s members returns a top-ten share of 24.5 percent instead of 23.4 percent and an effective count of 88.2 instead of 98.3, because the companies that later left the index were mid-sized earners whose absence tightens the distribution. That biased start shrinks the measured decline in effective count from 42.2 companies to 32.1, understating the change by 24 percent.
So what?
An index-level earnings forecast is mostly a forecast about ten companies and should be built that way. A bottom-up model aggregating 500 independent estimates assigns weight to names that no longer move the total, and its error is dominated by whichever of the five largest earners misses.
The result also constrains the bubble argument. Price concentration that outruns profit concentration will unwind on sentiment; price concentration that tracks it will not, and both have risen here.
For equal-weight investors the number to watch is the effective count rather than the top-ten weight. An equal-weighted S&P 500 holds roughly 0.2 percent in each of the ten companies producing 35.9 percent of the profit, an underweight to the earnings base that should be sized rather than inherited. And rebuild the roster point in time: the shortcut costs about a quarter of the effect here, always in the direction that makes the past resemble the present.
Built with xfinlink — free financial data API for Python. pip install -U xfinlink
pip install -U xfinlink