BLOG

Behind the numbers.

Code examples, market analysis, and data quality deep-dives.

Which Commodities Have the Strongest Momentum? Rotation Backtest in Python
Which Commodity ETFs Have the Worst Tail Risk? Expected Shortfall in Python
Are Gold Miners Leveraged Gold Bets? Rolling Beta Analysis in Python
Does the Base-Metals-to-Gold Ratio Lead Cyclical Stocks? Signal Test in Python
Can Risk Parity Tame Commodity Volatility? Portfolio Optimization in Python
Are Power Stocks Becoming an AI Infrastructure Trade? Momentum Screening in Python
Which AI Chip Stocks Have Margin Momentum? Profitability Trend Analysis in Python
Which AI Stocks Are Cheapest Relative to Growth? Growth-Adjusted Valuation in Python
Does AI Stock Leadership Persist? Momentum Backtest in Python
Which AI Stocks Have the Cleanest Balance Sheets? Net Cash Screening in Python
Can Risk Parity Reduce Mega-Cap Drawdowns? Portfolio Optimization in Python
Which Growth Stocks Are Self-Funding? Cash-Flow Quality Screening in Python
Which Sectors Struggle When the Dollar Rallies? Sector Rotation Analysis in Python
Do Cheap Stocks Hold Up When Bonds Sell Off? Valuation Rotation in Python
Does the Nasdaq 100 Have Better Growth Quality Than the Dow? Index Constituent Analysis in Python
Do Healthcare Cash-Flow Margins Predict Returns? Signal Evaluation in Python
Which Dividend Stocks Survive a Cash-Flow Stress Test? Dividend Screening in Python
Does Heavy Insider Selling Predict Weak Returns? Insider Flow Test in Python
Can Quality Screens Reduce Small-Cap Balance-Sheet Risk? Russell 2000 Test in Python
Which Retailers Have Positive Operating Leverage? Margin Screening in Python
Is MSTR a Leveraged Bitcoin Proxy? Rolling Beta Analysis in Python
Is Micron's Memory Cycle Recovering? Inventory and Margin Forecasting in Python
Which Sectors Work When Bonds Rally? Rate-Sensitive Rotation in Python
Do One-Month Price Extremes Reverse? Signal Evaluation in Python
Do Low-Volatility S&P 500 Stocks Reduce Drawdowns? Factor Test in Python
Is AI Capex Paying Back Fast Enough? Revenue Hurdle Forecasting in Python
Could Shorter AI Asset Lives Hit Earnings? Depreciation Stress Test in Python
How Much AI Capex Risk Can a Portfolio Remove? Constrained Optimization in Python
Is the AI Capex Trade Crowded? Rolling Volatility and Sector Rotation in Python
Did the AI Boom Come From Existing S&P 500 Members? Point-in-Time Momentum Test in Python
Is AI Revenue Circular? Customer-Vendor Capex Loop Analysis in Python
Is the AI Trade Connected to Private Credit? Rolling Correlation Network in Python
Is Apollo More Balance-Sheet Sensitive Than Peers? Leverage Screen in Python
Are AI Earnings Supported by Cash Flow? Accrual and Capex Screen in Python
Can Defensive Stocks Hedge AI Drawdowns? Basket Regime Test in Python
How Fast Does the Market Price In Fed Decisions? FOMC Event Study in Python
How Much Are Options Sellers Overpaid? The Variance Risk Premium in Python
Which Companies Have the Worst Earnings Quality? Sloan Accrual Screen with Geographic Revenue Data in Python
Does the Oil-to-Gold Ratio Signal Recessions? XLE/GLD Backtest in Python
Is AI Spending Crowding Out Free Cash Flow? Capex Sustainability Across the Mag 7 in Python
Does a Long Energy / Short Bonds Portfolio Capture Inflation Surprises? Factor Construction in Python
Can a Hidden Markov Model Detect Oil Market Regimes? HMM Analysis in Python
Do Grain Prices Predict Food Inflation? Granger Causality Test in Python
Does the Corporate Credit Spread Predict Stock Market Crashes? BAA-AAA Spread Analysis in Python
Do Oil Stocks Hedge Inflation? Rolling Beta Analysis in Python
Which Stocks Are Most Rate-Sensitive? Equity Duration via Bond Beta in Python
Which Companies Have the Highest Accrual Ratios? Earnings Quality Screening in Python
Is Alpha Persistent or Decaying? Rolling Sharpe Ratio Analysis in Python
Are Markets Trending or Mean-Reverting? Hurst Exponent Analysis in Python
Is Consumer Discretionary vs Staples a Leading Indicator? XLY/XLP Ratio Analysis in Python
Does Heavy Capex Predict Future Stock Returns? Capital Expenditure Analysis in Python
How to Estimate Cost of Equity Using CAPM in Python
Is Volatility Predictable? Testing for Volatility Clustering in Python
Which Industrials Are Overleveraged? Net Debt to EBITDA Screening in Python
GM Before and After Bankruptcy: Why Entity Resolution Matters for Financial Data
What Is Adjusted Beta? Merrill Lynch Beta Shrinkage in Python
How Good Is a Stock Pick? Information Ratio and Tracking Error in Python
Do Stock Returns Follow a Normal Distribution? Testing for Fat Tails in Python
Which Large Caps Have the Highest Free Cash Flow Yield? FCF Screening in Python
Which Sectors Won Over 5 Years? Sector Rotation Analysis in Python
How to Forecast Stock Volatility with GARCH Models in Python
Are Stock Prices Mean-Reverting? Augmented Dickey-Fuller Test in Python
How to Calculate CAPM Alpha and Beta with Regression in Python
How to Compare Sector Sharpe Ratios and Sortino Ratios in Python
DELL: Why Stitching Historical Price Data Together Is Wrong
How to Analyze Drawdown and Recovery for Bank Stocks in Python
How to Screen SaaS Stocks by Revenue Growth and Cash Flow in Python
How to Screen REITs by Dividend Yield and Valuation in Python
How Correlated Are the Magnificent 7? Intra-Group Correlation in Python
AAPL vs XOM: Do Individual Stocks Have Seasonal Patterns?
How to Rank Large-Cap Stocks by Momentum in Python
How to Build a Multi-Endpoint Financial Dashboard in Python
How to Compare Volatility Across Energy Stocks in Python
How to Screen Healthcare Stocks by Valuation in Python
How to Build a Sector Correlation Matrix for Portfolio Diversification in Python
How to Find Oversold and Overbought Stocks Using Z-Scores in Python
How to Measure Earnings Quality: Cash Flow vs Net Income in Python
How to Build a Multi-Factor Stock Screen in Python (Value + Momentum + Quality)
How to Build a Simple DCF Model for Any Stock in Python
How to Screen Tech Stocks by Revenue Growth in Python
How to Screen Stocks by Balance Sheet Health in Python
Is "Sell in May" Real? SPY Monthly Seasonality Over 10 Years
How to Compare Sector Performance YTD Using Python
How to Track S&P 500 Additions and Removals Over Time in Python
How to Screen Dividend Stocks by Yield and Quality in Python
How to Calculate Max Drawdown and Recovery Time for Any Stock in Python
How to Compare Profitability Across Mega-Cap Tech Stocks in Python
Why Ticker Symbols Are Unreliable: The Recycling Problem Every Quant Should Know
How to Calculate and Compare Stock Volatility in Python
How to Screen Blue-Chip Stocks by P/E Ratio in Python
How to Track Companies Through Ticker Changes, Bankruptcies, and Renames in Python
S&P 500 Turnover: How Much the Index Has Changed Since 2010
How to Calculate Stock Beta and Correlation in Python
← All articles

Are Gold Miners Leveraged Gold Bets? Rolling Beta Analysis in Python

What's the question?

Gold miners are often described as leveraged exposure to gold. The logic is intuitive. If the gold price rises while mining costs remain partly fixed, miner profits can rise faster than the metal price. If gold falls, the same operating leverage can work in reverse.

Beta gives this claim a measurable form. A beta of 1.5 to GLD means that, on average, a 1% daily move in GLD corresponds to a 1.5% move in the miner or miner ETF. Correlation measures how consistently the two move together.

The question is whether gold miners behave like amplified gold exposure in daily returns, and whether that relationship is stable enough to use in portfolio risk models.

The approach

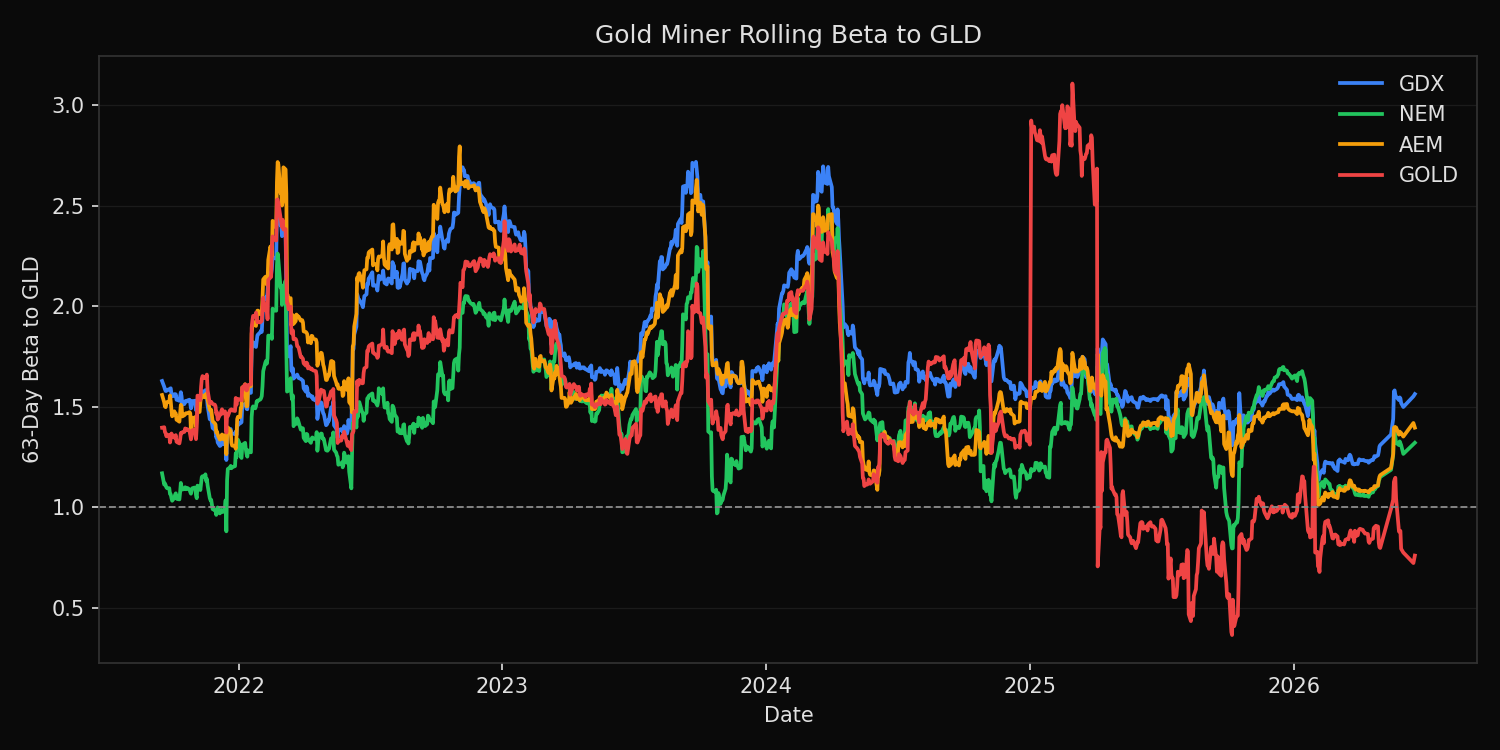
The test compares GDX, NEM, AEM, and GOLD against GLD. Built from SEC EDGAR public filings and market data, the analysis uses five years of daily returns.

  1. Pull daily returns for GLD and gold miner exposures
  2. Estimate full-sample beta as covariance with GLD divided by GLD variance
  3. Compute rolling 63-day beta to measure changing sensitivity
  4. Compute correlation and annualized volatility
  5. Compare up-capture and down-capture when GLD is positive or negative

Up-capture measures how much miners move on days when GLD rises. Down-capture measures the same relationship on days when GLD falls.

Code

import xfinlink as xfl
import pandas as pd
import numpy as np

xfl.set_api_key("YOUR_API_KEY")  # free at https://xfinlink.com/signup

tickers = ["GLD", "GDX", "NEM", "AEM", "GOLD"]
returns = xfl.prices(tickers, period="5y", fields=["return_daily"])
daily = returns.pivot_table(index="date", columns="ticker", values="return_daily").dropna()

rows = []
for ticker in ["GDX", "NEM", "AEM", "GOLD"]:
    beta = daily[ticker].cov(daily["GLD"]) / daily["GLD"].var()
    rolling_beta = daily[ticker].rolling(63).cov(daily["GLD"]) / daily["GLD"].rolling(63).var()
    rows.append({
        "ticker": ticker,
        "beta": beta,
        "latest_rolling_beta": rolling_beta.dropna().iloc[-1],
        "correlation": daily[ticker].corr(daily["GLD"]),
        "volatility": daily[ticker].std() * np.sqrt(252),
    })

print(pd.DataFrame(rows).sort_values("beta", ascending=False))

Full script with formatting and visualisation: gold-miner-beta-python.py

Output

Rolling beta of gold miners and gold miner ETF to GLD over five years
=== Gold Miner Beta to GLD ===
Universe: GDX, NEM, AEM, GOLD versus GLD
Sample: 2021-06-21 to 2026-06-17 (1234 trading days)
Rolling beta window: 63 trading days

Beta ranking:
GDX   full_beta= 1.62  latest_beta= 1.56  median_beta= 1.65  corr= 0.80  vol=36.4%  up_capture= 1.71x  down_capture= 1.80x
AEM   full_beta= 1.51  latest_beta= 1.40  median_beta= 1.57  corr= 0.74  vol=36.8%  up_capture= 1.63x  down_capture= 1.66x
NEM   full_beta= 1.40  latest_beta= 1.32  median_beta= 1.44  corr= 0.67  vol=37.7%  up_capture= 1.45x  down_capture= 1.55x
GOLD  full_beta= 1.30  latest_beta= 0.76  median_beta= 1.52  corr= 0.44  vol=52.6%  up_capture= 1.42x  down_capture= 1.43x

Highest beta: GDX at 1.62x GLD
Lowest beta:  GOLD at 1.30x GLD

What this tells us

Gold miners behaved like leveraged gold exposure over the sample. Every miner exposure had a beta above 1.0. GDX had the highest full-sample beta at 1.62, followed by AEM at 1.51, NEM at 1.40, and GOLD at 1.30.

The relationship is strongest for GDX. Its correlation with GLD is 0.80, and its latest rolling beta is 1.56, close to the full-sample estimate. That makes it the cleanest instrument in this group for amplified gold exposure.

Individual miners add company-specific risk. GOLD has a full-sample beta of 1.30, but its correlation is only 0.44 and its volatility is 52.6%. The lower correlation means more of its return variation comes from factors other than GLD, such as operating performance, jurisdiction exposure, costs, and balance-sheet risk.

So what?

Gold miners can increase gold sensitivity without using leverage, but they are not interchangeable with gold. The beta is higher, the volatility is higher, and individual company risk can weaken the hedge properties.

For portfolio construction, GDX is the cleaner beta instrument. Individual miners require a separate risk budget because their returns include both metal sensitivity and idiosyncratic equity risk. A gold allocation built with miners should be stress-tested as equity exposure, not only as commodity exposure.

Built with xfinlink — free financial data API for Python. pip install xfinlink

Built with xfinlink — free financial data API for Python. pip install xfinlink
← All articles