
What’s the question?
Share buybacks attract a recurring criticism: that companies borrow to repurchase their own stock, flattering earnings per share while leaving a weaker balance sheet behind. The opposite account is that buybacks are simply what a mature business does with cash it cannot reinvest, and that the borrowing is incidental.
Both claims are testable against the cash flow statement. A company returning capital to shareholders spends on two lines, dividends and repurchases, and generates free cash flow, which is operating cash flow after capital expenditure. When the first exceeds the second, the difference has to come from somewhere: the existing cash balance, asset sales, or new debt.
The question here is how often the payout runs ahead of the cash, and whether debt rises when it does. Whether repurchases happen at good prices is a separate question, taken up in a dollar-weighted analysis of buyback timing.
The approach
The sample is S&P 500 members from 2015 to 2024, judged on point-in-time membership so that each year contains the companies actually in the index at the time.
- Rebuild the index roster at the end of each year and address every company by identifier rather than ticker.
- Exclude financials and real estate. Free cash flow is built from operating cash flow and capital expenditure, and neither carries its ordinary meaning for a bank or an insurer.
- For every company-year, take repurchases, dividends paid, free cash flow and total debt from the annual statements.
- Define payout as repurchases plus dividends, and the gap as payout minus free cash flow.
- Difference total debt against the prior year for the same company, which is why the panel starts in 2015 rather than 2014.
- Split the company-years by whether the gap is positive, and compare what happened to debt in each group.
The 2015 row rests on a smaller sample than later years because a company needs a prior-year balance sheet to enter the panel at all.
Code
import pandas as pd
import xfinlink as xfl

xfl.set_api_key("YOUR_API_KEY")  # free at https://xfinlink.com/signup

roster = {y: set(xfl.index("sp500", as_of=f"{y}-12-31")["entity_id"])
          for y in range(2014, 2025)}

fund = xfl.fundamentals(entity_id=sorted(set().union(*roster.values())),
                        start="2013-06-01", end="2025-06-30", period_type="annual",
                        fields=["share_repurchases", "dividends_paid",
                                "free_cash_flow", "total_debt"], max_rows=200000)
fund = fund[~fund["gics_sector"].isin({"Financials", "Real Estate"})].dropna()
fund = fund[[e in roster.get(y, ()) for e, y in zip(fund["entity_id"], fund["fiscal_year"])]]
fund = fund.sort_values(["entity_id", "fiscal_year"])

fund["payout"] = fund["share_repurchases"] + fund["dividends_paid"]
fund["gap"] = fund["payout"] - fund["free_cash_flow"]
fund["debt_change"] = fund.groupby("entity_id")["total_debt"].diff()
panel = fund.dropna(subset=["debt_change"])

over = panel[panel["gap"] > 0]
print(over["debt_change"].median(), (over["debt_change"] > 0).mean())
Full script with formatting and visualisation: buybacks-funded-by-cash-flow-or-debt-python.py
Output
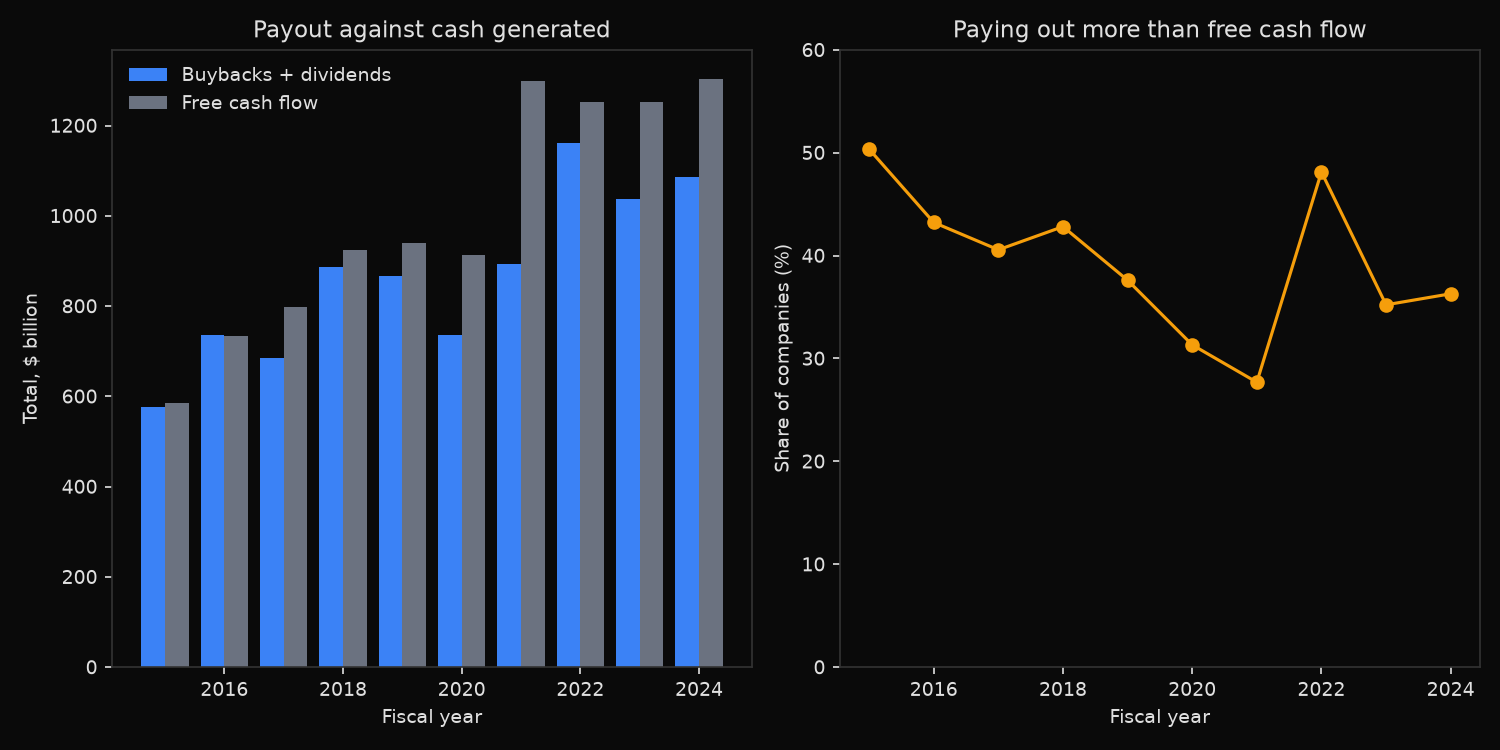
3525 company-years, 495 companies, 2015-2024

Aggregate payout against free cash flow, by year ($bn)
             buybacks_bn  dividends_bn   fcf_bn  payout_over_fcf  pct_cos_over      n
fiscal_year
2015              352.19        225.08   585.76             0.99         50.34  290.0
2016              436.07        300.19   733.10             1.00         43.22  354.0
2017              369.40        314.41   798.15             0.86         40.56  355.0
2018              566.14        320.76   923.45             0.96         42.82  348.0
2019              527.80        339.85   939.27             0.92         37.61  351.0
2020              404.12        331.41   912.54             0.81         31.32  348.0
2021              547.29        346.07  1299.54             0.69         27.69  372.0
2022              770.06        391.93  1252.27             0.93         48.13  374.0
2023              640.74        396.24  1252.17             0.83         35.22  372.0
2024              667.58        418.18  1302.65             0.83         36.29  361.0

Median change in total debt ($m), company-years split by payout vs free cash flow
payout above cash flow  n= 1378  median    256.8  share raising debt 65.5%
payout within cash flow n= 2147  median     -0.4  share raising debt 47.1%

By sector: share of company-years with payout above free cash flow
                        pct_over  median_debt_change    n
gics_sector
Utilities                   87.9               904.5  240
Consumer Discretionary      48.6                13.5  547
Consumer Staples            39.0                 7.4  344
Industrials                 37.1                 7.7  672
Materials                   36.1                 0.0  249
Energy                      34.7                 9.0  251
Information Technology      33.0                 0.0  509
Communication Services      24.4                25.4  164
Health Care                 24.0                 8.4  545

Concentration: share of all buyback dollars from the largest 20 spenders
top 20 of 495 companies = 43.2% of buybacks
What this tells us
In aggregate the criticism does not hold. Across all ten years the combined payout stayed at or below the combined free cash flow, ranging from 0.69 in 2021 to 1.00 in 2016. The index as a whole returned capital it had already earned.
The aggregate conceals the distribution. Between 27.7 and 50.3 per cent of individual companies paid out more than their free cash flow in any given year, and 1,378 of 3,525 company-years fall on that side. Large cash generators dominate the totals, which is visible in the concentration line: 20 of 495 companies account for 43.2 per cent of all repurchase dollars. Their surplus offsets everyone else’s shortfall in the sum, and only in the sum.
For the companies that did outspend their cash flow, debt rose. Median total debt increased by $256.8m in those company-years against a median of essentially zero for the rest, and 65.5 per cent of them raised debt against 47.1 per cent. The pattern the criticism describes is real; it is a property of a large minority of companies rather than of the index.
Utilities separate themselves completely. In 87.9 per cent of utility company-years the payout exceeded free cash flow, with median debt rising $904.5m. That is the regulated utility model working as designed, since heavy capital expenditure is financed with debt against a rate base while the dividend is treated as an obligation, and reading it as financial engineering would be a mistake. Health care at 24.0 per cent and communication services at 24.4 per cent sit at the other end.
The 2021 and 2022 pair is worth noting. Free cash flow jumped to $1,299.5bn in 2021 while payout stayed subdued after the pandemic, giving the lowest ratio in the sample. Repurchases then hit $770.1bn in 2022, the largest year here, and the share of companies outspending their cash flow rose to 48.1 per cent.
So what?
Judging buyback sustainability from index-level totals produces the wrong answer for most individual holdings. The aggregate ratio has never breached 1.0 in this sample, which says nothing about whether any particular company is funding its repurchases from operations.
The company-level check is two lines of arithmetic and belongs in any screen that treats shareholder yield as a quality signal. Repurchases plus dividends against free cash flow, then the year-on-year change in total debt, separates a company distributing surplus cash from one levering up to support a share count.
Sector context has to come first. Applying the test without it flags the entire utility sector as reckless, when the same reading in consumer discretionary or information technology, where roughly a third of company-years cross the line, carries real information about whether the payout can survive a bad year.