

Do Stocks Fall Harder Than They Rise? Downside Beta vs Upside Beta in Python
July 27, 2026
What’s the question?
Beta measures how far a stock moves when the market moves: a beta of 1.3 says a 1% market move usually comes with a 1.3% move in the stock. It averages rising and falling days together, assuming the relationship works the same way in both directions.
Investors do not price it that way. A stock that keeps pace on the way up but gives back less on the way down is worth more than one that behaves symmetrically, and much of the case for defensive allocations rests on that promise alone. Ang, Chen and Xing formalised the split in a 2006 Review of Financial Studies paper: downside beta is estimated only on days the market falls short of its own average, upside beta on the rest. Stocks carrying more downside beta earned higher returns.
The question tested below is narrower. When one stock shows a bigger gap between its downside and upside beta than another, is that a stable property of the company or an accident of the period measured?
The approach
The sample is 35 US large caps spanning all eleven GICS sectors, daily returns from 26 July 2021 to 24 July 2026, SPY standing in for the market. The window covers the 2022 bear market and the recoveries either side of it.
- Split trading days at the market’s own mean daily return, the Ang, Chen and Xing convention. The threshold sits at 5.12 basis points, putting 614 days below and 641 above.
- Estimate both betas in one regression carrying a separate intercept and slope per regime, with heteroskedasticity-robust standard errors. Coefficients match two subsample regressions, but one covariance matrix allows a direct test of the difference.
- Record the gap, downside beta minus upside beta, alongside its t statistic.
- Repeat on each half of the sample and compare the two sets of estimates by rank correlation.
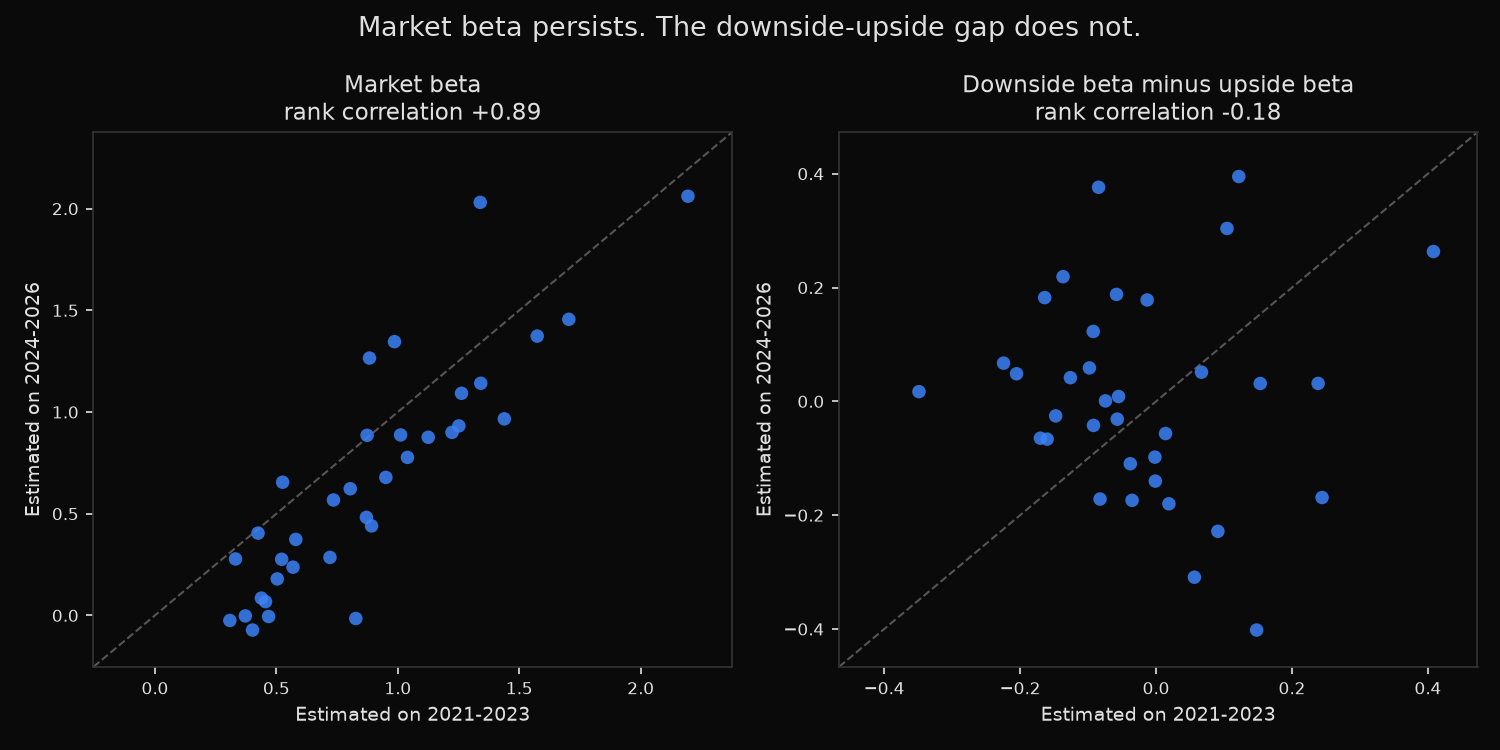
Step 4 carries the weight: a spread across names proves nothing unless the ordering survives into a period the estimate never saw. Market beta is the control, since it is known to persist.
Meta traded as FB for the window’s first eleven months; keying the panel on the entity rather than the ticker keeps that series continuous.
Code
import numpy as np
import pandas as pd
import statsmodels.api as sm
from scipy.stats import spearmanr
import xfinlink as xfl

xfl.set_api_key("YOUR_API_KEY")  # free at https://xfinlink.com/signup

TICKERS = ["AAPL", "MSFT", "NVDA", "AVGO", "CRM", "GOOG", "META", "DIS", "VZ",
           "AMZN", "HD", "MCD", "NKE", "PG", "KO", "PEP", "COST", "WMT", "JNJ",
           "UNH", "LLY", "ABBV", "JPM", "GS", "BAC", "XOM", "CVX", "CAT", "HON",
           "UNP", "NEE", "DUK", "LIN", "AMT", "PLD"]

px = xfl.prices(TICKERS + ["SPY"], start="2021-07-26", end="2026-07-24",
                fields=["close", "return_daily"], max_rows=200000)
px["label"] = px.groupby("entity_id")["ticker"].transform("last")
rets = px.pivot_table(index="date", columns="label", values="return_daily")
stocks = [c for c in rets.columns if c != "SPY"]

def conditional_betas(panel):
    mkt = panel["SPY"].dropna()
    mu = mkt.mean()
    out = {}
    for s in stocks:
        d = pd.concat([panel[s], mkt], axis=1, keys=["s", "m"]).dropna()
        down = (d["m"] < mu).astype(float)
        up = 1.0 - down
        X = np.column_stack([down, up, d["m"] * down, d["m"] * up])
        fit = sm.OLS(d["s"].values, X).fit(cov_type="HC1")
        contrast = fit.t_test(np.array([[0, 0, 1, -1]]))
        full = sm.OLS(d["s"].values, sm.add_constant(d["m"].values)).fit().params[1]
        out[s] = dict(beta=full, beta_dn=fit.params[2], beta_up=fit.params[3],
                      gap=fit.params[2] - fit.params[3],
                      tstat=float(np.ravel(contrast.tvalue)[0]),
                      pval=float(np.ravel(contrast.pvalue)[0]))
    return pd.DataFrame(out).T.astype(float)

full = conditional_betas(rets).sort_values("gap", ascending=False)

mid = rets.index[len(rets) // 2]
h1 = conditional_betas(rets[rets.index < mid])
h2 = conditional_betas(rets[rets.index >= mid])
for c in ["beta", "beta_dn", "beta_up", "gap"]:
    r = spearmanr(h1[c], h2[c])
    print(f"{c:8s} Spearman {r.statistic:+.3f}  p = {r.pvalue:.4f}")
Full script with formatting and visualisation: downside-beta-asymmetry-python.py
Output
Universe: 35 large caps + SPY   2021-07-26 to 2026-07-24
Trading days: 1255   market mean daily return: 5.12 bp   down days: 614   up days: 641

FULL SAMPLE - conditional betas vs SPY (sorted by downside minus upside)
          beta   beta-   beta+     gap       t       p
AMZN     1.488   1.678   1.335  +0.343   +2.05   0.040
CVX      0.491   0.780   0.529  +0.251   +1.77   0.077
XOM      0.425   0.656   0.451  +0.205   +1.46   0.144
BAC      0.959   1.034   0.877  +0.157   +1.06   0.289
ABBV     0.308   0.461   0.326  +0.135   +1.08   0.282
VZ       0.211   0.295   0.189  +0.106   +0.88   0.378
CAT      1.049   1.033   0.946  +0.087   +0.69   0.490
CRM      1.233   1.250   1.193  +0.057   +0.35   0.725
COST     0.696   0.744   0.694  +0.050   +0.37   0.713
AMT      0.463   0.524   0.480  +0.044   +0.22   0.826
LLY      0.581   0.613   0.571  +0.042   +0.30   0.764
HON      0.725   0.751   0.716  +0.035   +0.22   0.825
DIS      1.018   1.115   1.122  -0.007   -0.06   0.953
DUK      0.198   0.220   0.234  -0.014   -0.11   0.913
JPM      0.879   0.885   0.899  -0.014   -0.13   0.899
MCD      0.363   0.372   0.389  -0.017   -0.13   0.900
AVGO     1.638   1.547   1.569  -0.022   -0.14   0.889
KO       0.264   0.309   0.331  -0.022   -0.18   0.853
JNJ      0.165   0.193   0.233  -0.040   -0.39   0.698
MSFT     1.112   1.079   1.120  -0.041   -0.40   0.691
NVDA     2.136   2.012   2.065  -0.053   -0.29   0.770
PLD      0.926   0.938   0.997  -0.060   -0.47   0.642
UNH      0.415   0.463   0.529  -0.065   -0.44   0.661
UNP      0.663   0.662   0.729  -0.067   -0.74   0.462
GOOG     1.256   1.192   1.259  -0.067   -0.48   0.629
PEP      0.287   0.332   0.400  -0.069   -0.69   0.492
LIN      0.702   0.713   0.783  -0.071   -0.78   0.435
GS       1.142   1.025   1.103  -0.078   -0.68   0.495
PG       0.286   0.283   0.372  -0.089   -0.77   0.440
WMT      0.417   0.446   0.555  -0.109   -0.72   0.473
AAPL     1.189   1.194   1.305  -0.111   -1.08   0.278
NKE      1.083   1.071   1.186  -0.116   -0.56   0.572
HD       0.833   0.725   0.843  -0.118   -0.82   0.411
META     1.597   1.593   1.711  -0.118   -0.57   0.567
NEE      0.534   0.481   0.612  -0.131   -0.87   0.382

Mean gap across 35 names: +0.0005 (cross-sectional SD 0.112)
Names with gap > 0: 12 of 35
Gaps significant at p<0.05: 1 (expected by chance at 5%: 1.8)

OUT OF SAMPLE - rank correlation between first half (to 2024-01-23) and second half
  market beta            Spearman +0.890   p = 0.0000
  downside beta          Spearman +0.828   p = 0.0000
  upside beta            Spearman +0.773   p = 0.0000
  downside minus upside  Spearman -0.179   p = 0.3028

Cross-sectional SD of the gap: first half 0.150, second half 0.182
Names keeping the sign of their gap in both halves: 16 of 35 (coin flip: 17.5)
Top 7 by first-half gap:    first half +0.203 -> second half +0.065
Bottom 7 by first-half gap: first half -0.203 -> second half +0.023
What this tells us
Across the full sample the average asymmetry is absent. The mean gap is +0.0005 and 12 of 35 names come out positive, a coin flip. One name clears the 5% threshold, AMZN at +0.343 with a p-value of 0.040, against the 1.8 that 35 tests throw up by chance.
Individual numbers still look substantial. CVX carries a downside beta of 0.780 against an upside beta of 0.529, a gap of 0.251 on a stock whose overall beta is 0.491. NEE runs the other way at -0.131. Differences that size invite a portfolio decision.
The split-half test settles it. Market beta ranks carry across the two periods at Spearman +0.890, downside beta at +0.828 and upside beta at +0.773, both persisting because they are dominated by the stock’s overall beta. The difference between them lands at -0.179 with a p-value of 0.30, indistinguishable from zero and pointing the wrong way. Only 16 of 35 names keep the sign of their gap, fewer than the 17.5 random assignment produces, and the seven widest first-half gaps fall from +0.203 to +0.065 while the seven narrowest rise from -0.203 to +0.023. A spread of 0.41 shrinks to 0.04.
Dispersion does not fade, sitting at 0.150 then 0.182. The spread is real in each period but describes different companies each time, the signature of estimation error rather than a company characteristic. Subtracting two quantities each measured with error and each close to the same underlying number leaves noise.
So what?
Screening on downside beta, up-capture minus down-capture, or any similar difference of two conditional estimates should not drive position sizing on five years of daily data. The ranking will be close to random by the time positions are held. The measure needs far longer histories, shrinkage toward the cross-sectional mean, or application at portfolio level, where averaging cancels part of the error.
For most risk work one beta is enough. Market beta persists at +0.89 and is stable enough to size positions against; downside beta at +0.83 adds little beyond it, inheriting that stability from the same source.
The habit matters more than the measure. Any factor built as the difference between two noisy estimates deserves the same treatment before it reaches a portfolio: split the sample, re-estimate, check whether the ordering holds.
Built with xfinlink — free financial data API for Python. pip install xfinlink
pip install xfinlink