
What’s the question?
Any business that sells physical goods pays out before it collects. It buys inventory, holds it, sells it, then waits for the customer to settle the invoice. Cash is trapped for the whole of that stretch, and someone has to fund the gap: the company, its lenders, or its suppliers.
The cash conversion cycle measures that gap in days. Days sales outstanding (DSO) is how long customers take to pay, receivables divided by daily revenue. Days inventory outstanding (DIO) is how long goods sit before they sell, inventory divided by daily cost of sales. Days payables outstanding (DPO) is how long the company takes to pay its own suppliers, payables divided by daily cost of sales. The cycle is DSO plus DIO minus DPO.
A positive cycle means cash is locked up in operations. A negative cycle means the reverse: money arrives from customers before the supplier invoices fall due, so the suppliers are financing the working capital. That funding carries no interest rate and appears on no debt schedule, which is exactly why it is easy to miss. How wide is the spread across sectors, and does the sector label or the business model decide where a company lands?
The approach
The sample is 38 large non-financial US companies drawn from consumer staples, consumer discretionary, information technology, health care, industrials and energy. Financial firms and property companies are excluded: they hold no inventory and report no cost of sales, so the measure describes nothing about how they work. Companies whose balance sheet merges payables with accrued expenses into one line are also left out, since the merged figure inflates days payable.
- Pull the two most recent annual filings for each company, taking revenue, cost of revenue, receivables, inventory and payables.
- Average each balance-sheet item across the two year-ends, so that one reporting-date snapshot does not drive the answer.
- Compute DSO against revenue, then DIO and DPO against cost of revenue, all annualised on a 365-day year.
- Add DSO and DIO, subtract DPO, and compare each company against its sector median.
Code
import pandas as pd
import xfinlink as xfl

xfl.set_api_key("YOUR_API_KEY")  # free at https://xfinlink.com/signup

TICKERS = ["COST", "TGT", "KR", "SYY", "PG", "PEP", "CL", "GIS",
           "HD", "LOW", "ORLY", "AZO", "GPC", "NKE", "TSLA",
           "AAPL", "DELL", "CSCO", "NVDA", "TXN", "INTC",
           "MCK", "CVS", "JNJ", "PFE", "MRK", "LLY", "ABBV", "AMGN",
           "CAT", "HON", "LMT", "EMR", "ETN", "GWW",
           "CVX", "MPC", "VLO"]

df = xfl.fundamentals(
    TICKERS, period_type="annual", start="2023-01-01",
    fields=["ticker", "gics_sector", "period_end", "revenue",
            "cost_of_revenue", "accounts_receivable", "inventory",
            "accounts_payable"],
).sort_values(["ticker", "period_end"])

rows = []
for ticker, group in df.groupby("ticker"):
    group = group.tail(2)
    cur, prev = group.iloc[-1], group.iloc[-2]
    receivables = (cur.accounts_receivable + prev.accounts_receivable) / 2
    stock = (cur.inventory + prev.inventory) / 2
    payables = (cur.accounts_payable + prev.accounts_payable) / 2

    dso = 365 * receivables / cur.revenue
    dio = 365 * stock / cur.cost_of_revenue
    dpo = 365 * payables / cur.cost_of_revenue

    rows.append({"ticker": ticker, "sector": cur.gics_sector,
                 "fy_end": cur.period_end.date(), "dso": dso,
                 "dio": dio, "dpo": dpo, "ccc": dso + dio - dpo})

cycle = pd.DataFrame(rows).sort_values("ccc")
print(cycle.to_string(index=False))
print(cycle.groupby("sector")["ccc"].agg(["count", "median", "min", "max"]))
Full script with formatting and visualisation: cash-conversion-cycle-analysis-python.py
Output
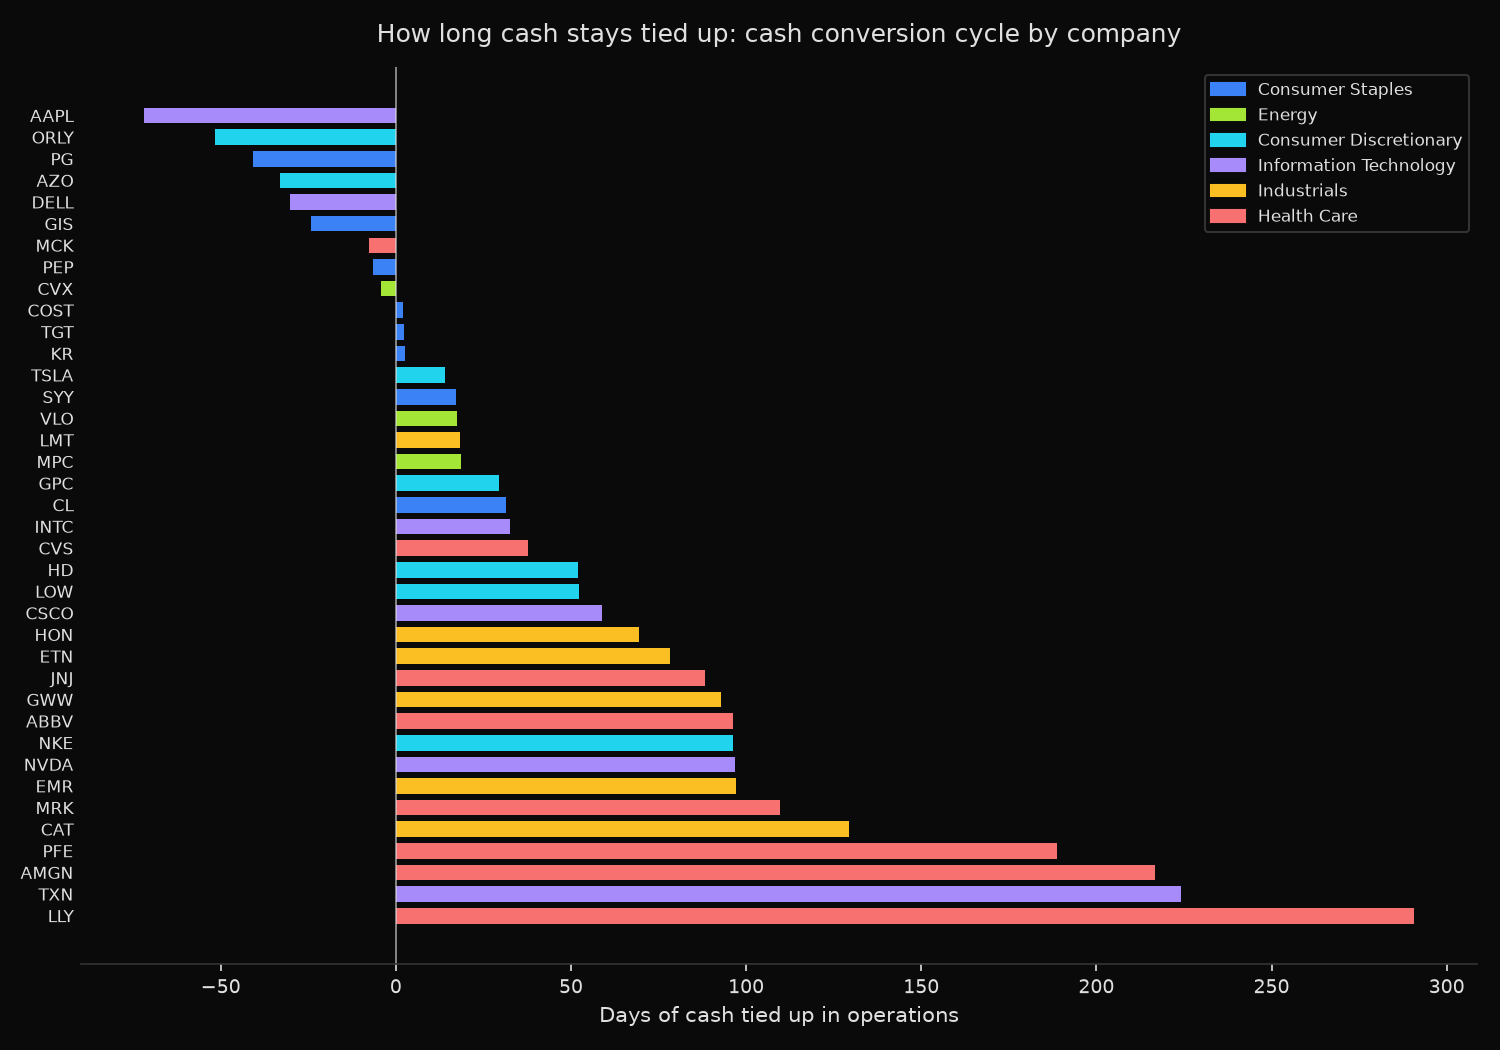
Cash conversion cycle, latest annual filing (days)
DSO = receivable days, DIO = inventory days, DPO = payable days

ticker sector                  fy end          DSO     DIO     DPO      CCC
---------------------------------------------------------------------------
AAPL   Information Technology  2025-09-27     32.1    10.7   114.7    -71.8
ORLY   Consumer Discretionary  2025-12-31      7.7   229.6   288.9    -51.7
PG     Consumer Staples        2026-06-30     25.7    66.2   132.7    -40.9
AZO    Consumer Discretionary  2025-08-30     11.7   268.1   312.9    -33.0
DELL   Information Technology  2026-01-30     44.8    34.5   109.4    -30.1
GIS    Consumer Staples        2026-05-31     34.1    57.1   115.5    -24.3
MCK    Health Care             2026-03-31     24.3    22.2    54.1     -7.7
PEP    Consumer Staples        2025-12-27     42.4    47.3    96.2     -6.5
CVX    Energy                  2025-12-31     34.0    31.7    69.8     -4.1
COST   Consumer Staples        2025-08-31      3.9    28.0    29.8      2.1
TGT    Consumer Staples        2026-01-31      3.9    60.5    62.1      2.4
KR     Consumer Staples        2026-01-31      5.4    30.4    33.2      2.6
TSLA   Consumer Discretionary  2025-12-31     17.3    57.3    60.7     13.9
SYY    Consumer Staples        2026-06-27     24.5    27.5    34.8     17.2
VLO    Energy                  2025-12-31     28.2    23.9    34.6     17.5
LMT    Industrials             2025-12-31     15.2    18.9    15.8     18.3
MPC    Energy                  2025-12-31     29.5    30.1    41.1     18.5
GPC    Consumer Discretionary  2025-12-31     34.2   137.7   142.3     29.6
CL     Consumer Staples        2025-12-31     28.6    90.2    87.4     31.4
INTC   Information Technology  2025-12-27     25.3   126.1   118.8     32.6
CVS    Health Care             2025-12-31     34.6    30.8    27.7     37.8
HD     Consumer Discretionary  2026-02-01      9.9    77.8    35.8     51.9
LOW    Consumer Discretionary  2026-01-30      2.3   108.7    58.7     52.3
CSCO   Information Technology  2025-07-26     43.1    60.1    44.4     58.8
HON    Industrials             2025-12-31     72.5    93.1    96.0     69.5
ETN    Industrials             2025-12-31     66.5    95.3    83.6     78.3
JNJ    Health Care             2025-12-28     62.0   160.7   134.5     88.2
GWW    Industrials             2025-12-31     46.4    78.5    32.0     92.9
ABBV   Health Care             2025-12-31     70.1    91.6    65.5     96.2
NKE    Consumer Discretionary  2026-05-31     41.9   103.3    48.8     96.4
NVDA   Information Technology  2026-01-25     52.0    92.0    47.1     96.9
EMR    Industrials             2025-09-30     61.1    94.4    58.4     97.0
MRK    Health Care             2025-12-31     61.9   142.2    94.5    109.6
CAT    Industrials             2025-12-31     54.5   142.6    67.9    129.3
PFE    Health Care             2025-12-31     68.1   244.3   123.5    188.8
AMGN   Health Care             2025-12-31     81.2   200.5    64.8    216.9
TXN    Information Technology  2025-12-31     38.0   224.1    37.8    224.2
LLY    Health Care             2025-12-31     80.5   352.3   142.1    290.7

Sector medians
sector                     n    median      min      max
--------------------------------------------------------
Consumer Staples           8       2.2    -40.9     31.4
Energy                     3      17.5     -4.1     18.5
Consumer Discretionary     7      29.6    -51.7     96.4
Information Technology     6      45.7    -71.8    224.2
Industrials                6      85.6     18.3    129.3
Health Care                8     102.9     -7.7    290.7
What this tells us
The spread runs 362 days from end to end. Apple sits at minus 71.8 days, Eli Lilly at plus 290.7, and both are profitable, well-managed companies. Sector medians fall in a clean order: consumer staples 2.2 days, energy 17.5, consumer discretionary 29.6, information technology 45.7, industrials 85.6, health care 102.9.
The negative-cycle names get there by two routes. Grocers and general merchandisers collect at the till, so receivable days barely register: 3.9 for Costco, 5.4 for Kroger, 3.9 for Target. Each still holds four to nine weeks of stock, but supplier terms of matching length cancel it out, which is why all three land within a day of zero. The auto parts retailers push harder. O’Reilly carries 229.6 days of inventory and AutoZone 268.1, and each pays its suppliers later still, at 288.9 and 312.9 days. Every dollar of parts on those shelves is funded by a vendor.
At the long end, part of the reading reflects margin rather than sloth. DIO divides inventory by cost of sales, so a business with an 83% gross margin is dividing by a small denominator. Eli Lilly’s 352.3 inventory days come from carrying roughly a year of production valued at cost against a cost base one sixth the size of revenue.
The sector label explains less than the ordering suggests. Information technology holds both the shortest cycle and one of the longest: Apple at minus 71.8 against Texas Instruments at plus 224.2, a gap of 296 days inside one classification. Apple outsources assembly and settles with contract manufacturers on long terms, while Texas Instruments owns its fabrication plants and holds the wafers.
So what?
The cycle converts straight into money. Multiply the days by daily cost of sales and the result is the cash permanently parked in operations. For Caterpillar, 129.3 days against a $44.8bn cost base is roughly $15.9bn of funding that never comes back while the business runs at its current size. That is the figure to weigh against the cost of debt, not the abstract day count.
Growth is where the sign matters. A company on a 100-day cycle that grows revenue 20% must fund an extra 20% of working capital before any of the additional profit lands, which is the mechanism behind the profitable company that runs out of cash. For a negative-cycle company, growth releases cash instead.
Two rules make the measure usable. Compare within a business model rather than within a sector, so O’Reilly against AutoZone and Costco against Kroger, never a retailer against a drug manufacturer. For a single company, watch the change in the cycle rather than its level, since the margin effect on inventory days is roughly constant for that firm and cancels out year to year. A cycle that lengthens by 20 days on flat revenue says inventory is building or customers are paying more slowly.
Built with xfinlink — free financial data API for Python.