
What’s the question?
Inventory is the one asset on the balance sheet that loses value simply by sitting there. A retailer holding last season’s coats faces one decision eventually: cut the price or write the goods off. Both land in cost of goods sold, and both compress gross margin.
That gives a testable hypothesis. When inventory grows materially faster than revenue, the company has produced or bought more than it sold, and the excess has to clear somehow. If it clears through discounting, the following year’s gross margin should come in lower.
Gross margin here means revenue less cost of revenue, divided by revenue, in percentage points. The measure of the build is inventory growth minus revenue growth, both year on year, so a company whose inventory rose 30 percent while revenue rose 5 percent scores +25. Scaling against revenue matters, since a fast-growing company is supposed to carry more stock. An analysis of gross margin return on inventory weighs turnover speed against gross margin.
The approach
The sample is every company that sat in the S&P 500 at any year end between 2013 and 2024, addressed by entity identifier so that a rename does not split one company’s history into two. Fundamentals are annual through fiscal 2024.
- Derive each row’s year from its period end rather than its fiscal-year label, which keeps 52-week and January-ending filers in the right year.
- Keep only businesses where inventory is a real part of the operation. Financials and real estate hold no trading stock in the ordinary sense, and a regulated utility passes fuel costs through rather than discounting to clear them, so those three sectors come out, as does any company-year with inventory under 2 percent of revenue.
- Require three consecutive annual periods per observation: years t-1 and t give the inventory build, years t and t+1 the margin outcome. Signal years run 2014 through 2023.
- Sort the build into quintiles within each signal year, which stops a general margin expansion in one year from driving the result, then measure the median change in gross margin from year t to t+1 in each quintile.
One further screen drops company-years where reported gross margin moves more than 20 points in a single year, in either direction, since a swing that large reflects a change in what the business sells rather than a pricing decision. What remains is 2,949 company-years across 371 companies.
Code
import pandas as pd
import xfinlink as xfl

xfl.set_api_key("YOUR_API_KEY")  # free at https://xfinlink.com/signup

ids = set()
for y in range(2013, 2025):
    ids.update(int(i) for i in xfl.index("sp500", as_of="%d-12-31" % y)["entity_id"].dropna())

fun = xfl.fundamentals(entity_id=sorted(ids), start="2012-06-30", end="2025-06-30",
                       period_type="annual",
                       fields=["revenue", "cost_of_revenue", "inventory"],
                       max_rows=60000)
fun["year"] = fun["period_end"].dt.year - (fun["period_end"].dt.month <= 6).astype(int)

fun = fun[~fun["gics_sector"].isin(["Financials", "Real Estate", "Utilities"])]
fun = fun.dropna(subset=["revenue", "cost_of_revenue", "inventory"])
fun = fun.sort_values(["entity_id", "year"]).drop_duplicates(["entity_id", "year"], keep="last")
fun["gm"] = (fun["revenue"] - fun["cost_of_revenue"]) / fun["revenue"] * 100

g = fun.groupby("entity_id")
for c in ["revenue", "inventory", "gm", "year"]:
    fun["p_" + c] = g[c].shift(1)
    fun["n_" + c] = g[c].shift(-1)

d = fun[(fun["year"] - fun["p_year"] == 1) & (fun["n_year"] - fun["year"] == 1)].copy()
d = d[(d["year"] >= 2014) & (d["year"] <= 2023)]
d = d[(d["inventory"] / d["revenue"] >= 0.02) & (d["p_inventory"] / d["p_revenue"] >= 0.02)]

d["gap"] = (d["inventory"] / d["p_inventory"] - 1) * 100 - (d["revenue"] / d["p_revenue"] - 1) * 100
d["d_gm_next"] = d["n_gm"] - d["gm"]
d = d[(d["d_gm_next"].abs() <= 20) & ((d["gm"] - d["p_gm"]).abs() <= 20)]

d["q"] = d.groupby("year")["gap"].transform(lambda s: pd.qcut(s, 5, labels=list("12345")))
print(d.groupby("q", observed=True)["d_gm_next"].median())
Full script with formatting and visualisation: inventory-build-margin-squeeze-python.py
Output
Point-in-time S&P 500 rosters at each year end 2013-2024
company-years after screens: 2949 (371 companies, signal years 2014-2023)

quintiles of inventory growth minus revenue growth, formed within each year
                       n    gap     gm  d_gm  d_gm_mean   fell  rev_next
q
Q1 inventory lags    594 -18.87  41.75  0.45       0.42  41.41      4.15
Q2                   588  -5.06  37.78  0.10      -0.00  46.77      4.08
Q3                   587   0.96  36.44 -0.01      -0.01  50.26      3.41
Q4                   588   6.98  39.01 -0.03      -0.14  51.19      4.78
Q5 inventory builds  592  23.67  45.05 -0.41      -0.67  58.28      6.46

top minus bottom quintile
  next-year change in gross margin, median  -0.86 points
  next-year change in gross margin, mean    -1.08 points
  Welch t-statistic on the means            -4.63
  next-year revenue growth, median          +2.30 points

double sort, quintiles formed within year and starting-margin tercile
  spread -0.77 points (n=2949)

spread by signal year
year    2014  2015  2016  2017  2018  2019  2020  2021  2022  2023
spread -0.13 -0.68 -0.42 -0.64  -1.1  0.14 -0.94 -0.99 -0.79 -2.12
  negative in 9 of 10 years

spread by sector
                        Q1 inventory lags  Q5 inventory builds  spread    n
Energy                               1.26                -0.99   -2.26  151
Communication Services               0.40                -1.68   -2.08   60
Consumer Staples                     0.56                -0.72   -1.28  378
Consumer Discretionary               0.74                -0.29   -1.03  556
Information Technology               0.72                -0.15   -0.87  434
Materials                            0.04                -0.79   -0.83  289
Health Care                          0.25                -0.56   -0.81  564
Industrials                          0.34                -0.12   -0.46  517
What this tells us
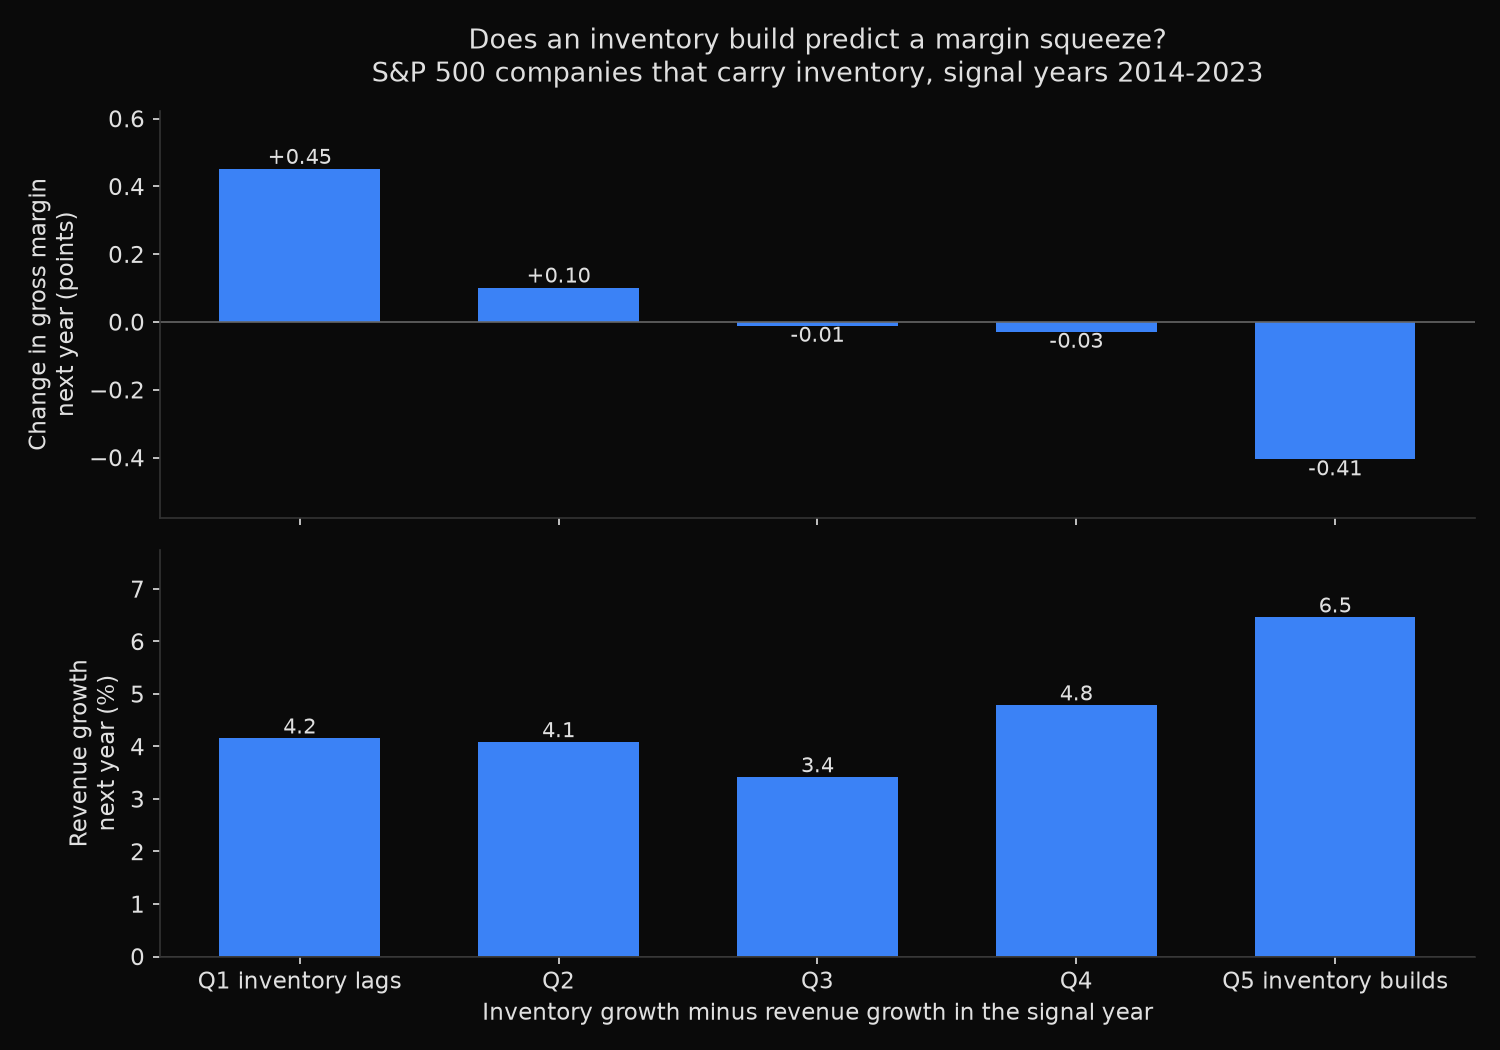
The hypothesis survives, at a size worth knowing. Companies whose inventory grew about 24 points faster than revenue lost a median 0.41 points of gross margin the next year, while those whose inventory lagged revenue by about 19 points gained 0.45. The spread is 0.86 points on medians, 1.08 on means, with a Welch t-statistic of -4.63.
The progression across the buckets is close to monotone, and the share of companies whose margin fell at all tracks it, from 41 percent in the bottom quintile to 58 percent in the top. A signal that shifts a coin flip from 41-59 to 58-42 does real work without being a rule.
One objection deserves an answer. The top quintile starts with a higher gross margin, a median 45.05 points against 41.75, and high margins tend to fall on their own. Forming the quintiles inside each starting-margin tercile as well as each year removes that channel, and the spread narrows only to 0.77 points.
Nine of the ten signal years produce a negative spread, 2019 being the exception at +0.14, and all eight sectors are negative, from energy at -2.26 points to industrials at -0.46.
Revenue growth moves the other way, and that is the more surprising number: the top quintile grew revenue 6.46 percent the following year against 4.15 percent for the bottom. Companies building inventory are not, on the whole, companies whose demand collapsed. They are preparing for growth that mostly arrives, and paying for it in price.
So what?
Treat an inventory build as a margin forecast rather than a demand warning. When inventory outruns revenue by 20 points or more, the base case is roughly half a point of gross margin lost next year, with revenue growth arriving anyway. A model that cuts both the margin and the revenue line on the same signal is cutting one of them in the wrong direction.
Half a point of gross margin on a 40 percent margin business is a little over one percent of gross profit, so the number is a tilt rather than a screen, useful next to other measures of earnings quality.
The practical version is a watchlist: compute inventory growth minus revenue growth on every annual filing, flag the names in the top fifth of that year’s distribution, then check their guidance. The signal pays where management guides to a stable margin on a balance sheet that already shows the discount coming.
Built with xfinlink — free financial data API for Python.