BLOG

Behind the numbers.

Code examples, market analysis, and data quality deep-dives.

Are Power Stocks Becoming an AI Infrastructure Trade? Momentum Screening in Python
Which AI Chip Stocks Have Margin Momentum? Profitability Trend Analysis in Python
Which AI Stocks Are Cheapest Relative to Growth? Growth-Adjusted Valuation in Python
Does AI Stock Leadership Persist? Momentum Backtest in Python
Which AI Stocks Have the Cleanest Balance Sheets? Net Cash Screening in Python
Can Risk Parity Reduce Mega-Cap Drawdowns? Portfolio Optimization in Python
Which Growth Stocks Are Self-Funding? Cash-Flow Quality Screening in Python
Which Sectors Struggle When the Dollar Rallies? Sector Rotation Analysis in Python
Do Cheap Stocks Hold Up When Bonds Sell Off? Valuation Rotation in Python
Does the Nasdaq 100 Have Better Growth Quality Than the Dow? Index Constituent Analysis in Python
Do Healthcare Cash-Flow Margins Predict Returns? Signal Evaluation in Python
Which Dividend Stocks Survive a Cash-Flow Stress Test? Dividend Screening in Python
Does Heavy Insider Selling Predict Weak Returns? Insider Flow Test in Python
Can Quality Screens Reduce Small-Cap Balance-Sheet Risk? Russell 2000 Test in Python
Which Retailers Have Positive Operating Leverage? Margin Screening in Python
Is MSTR a Leveraged Bitcoin Proxy? Rolling Beta Analysis in Python
Is Micron's Memory Cycle Recovering? Inventory and Margin Forecasting in Python
Which Sectors Work When Bonds Rally? Rate-Sensitive Rotation in Python
Do One-Month Price Extremes Reverse? Signal Evaluation in Python
Do Low-Volatility S&P 500 Stocks Reduce Drawdowns? Factor Test in Python
Is AI Capex Paying Back Fast Enough? Revenue Hurdle Forecasting in Python
Could Shorter AI Asset Lives Hit Earnings? Depreciation Stress Test in Python
How Much AI Capex Risk Can a Portfolio Remove? Constrained Optimization in Python
Is the AI Capex Trade Crowded? Rolling Volatility and Sector Rotation in Python
Did the AI Boom Come From Existing S&P 500 Members? Point-in-Time Momentum Test in Python
Is AI Revenue Circular? Customer-Vendor Capex Loop Analysis in Python
Is the AI Trade Connected to Private Credit? Rolling Correlation Network in Python
Is Apollo More Balance-Sheet Sensitive Than Peers? Leverage Screen in Python
Are AI Earnings Supported by Cash Flow? Accrual and Capex Screen in Python
Can Defensive Stocks Hedge AI Drawdowns? Basket Regime Test in Python
How Fast Does the Market Price In Fed Decisions? FOMC Event Study in Python
How Much Are Options Sellers Overpaid? The Variance Risk Premium in Python
Which Companies Have the Worst Earnings Quality? Sloan Accrual Screen with Geographic Revenue Data in Python
Does the Oil-to-Gold Ratio Signal Recessions? XLE/GLD Backtest in Python
Is AI Spending Crowding Out Free Cash Flow? Capex Sustainability Across the Mag 7 in Python
Does a Long Energy / Short Bonds Portfolio Capture Inflation Surprises? Factor Construction in Python
Can a Hidden Markov Model Detect Oil Market Regimes? HMM Analysis in Python
Do Grain Prices Predict Food Inflation? Granger Causality Test in Python
Does the Corporate Credit Spread Predict Stock Market Crashes? BAA-AAA Spread Analysis in Python
Do Oil Stocks Hedge Inflation? Rolling Beta Analysis in Python
Which Stocks Are Most Rate-Sensitive? Equity Duration via Bond Beta in Python
Which Companies Have the Highest Accrual Ratios? Earnings Quality Screening in Python
Is Alpha Persistent or Decaying? Rolling Sharpe Ratio Analysis in Python
Are Markets Trending or Mean-Reverting? Hurst Exponent Analysis in Python
Is Consumer Discretionary vs Staples a Leading Indicator? XLY/XLP Ratio Analysis in Python
Does Heavy Capex Predict Future Stock Returns? Capital Expenditure Analysis in Python
How to Estimate Cost of Equity Using CAPM in Python
Is Volatility Predictable? Testing for Volatility Clustering in Python
Which Industrials Are Overleveraged? Net Debt to EBITDA Screening in Python
GM Before and After Bankruptcy: Why Entity Resolution Matters for Financial Data
What Is Adjusted Beta? Merrill Lynch Beta Shrinkage in Python
How Good Is a Stock Pick? Information Ratio and Tracking Error in Python
Do Stock Returns Follow a Normal Distribution? Testing for Fat Tails in Python
Which Large Caps Have the Highest Free Cash Flow Yield? FCF Screening in Python
Which Sectors Won Over 5 Years? Sector Rotation Analysis in Python
How to Forecast Stock Volatility with GARCH Models in Python
Are Stock Prices Mean-Reverting? Augmented Dickey-Fuller Test in Python
How to Calculate CAPM Alpha and Beta with Regression in Python
How to Compare Sector Sharpe Ratios and Sortino Ratios in Python
DELL: Why Stitching Historical Price Data Together Is Wrong
How to Analyze Drawdown and Recovery for Bank Stocks in Python
How to Screen SaaS Stocks by Revenue Growth and Cash Flow in Python
How to Screen REITs by Dividend Yield and Valuation in Python
How Correlated Are the Magnificent 7? Intra-Group Correlation in Python
AAPL vs XOM: Do Individual Stocks Have Seasonal Patterns?
How to Rank Large-Cap Stocks by Momentum in Python
How to Build a Multi-Endpoint Financial Dashboard in Python
How to Compare Volatility Across Energy Stocks in Python
How to Screen Healthcare Stocks by Valuation in Python
How to Build a Sector Correlation Matrix for Portfolio Diversification in Python
How to Find Oversold and Overbought Stocks Using Z-Scores in Python
How to Measure Earnings Quality: Cash Flow vs Net Income in Python
How to Build a Multi-Factor Stock Screen in Python (Value + Momentum + Quality)
How to Build a Simple DCF Model for Any Stock in Python
How to Screen Tech Stocks by Revenue Growth in Python
How to Screen Stocks by Balance Sheet Health in Python
Is "Sell in May" Real? SPY Monthly Seasonality Over 10 Years
How to Compare Sector Performance YTD Using Python
How to Track S&P 500 Additions and Removals Over Time in Python
How to Screen Dividend Stocks by Yield and Quality in Python
How to Calculate Max Drawdown and Recovery Time for Any Stock in Python
How to Compare Profitability Across Mega-Cap Tech Stocks in Python
Why Ticker Symbols Are Unreliable: The Recycling Problem Every Quant Should Know
How to Calculate and Compare Stock Volatility in Python
How to Screen Blue-Chip Stocks by P/E Ratio in Python
How to Track Companies Through Ticker Changes, Bankruptcies, and Renames in Python
S&P 500 Turnover: How Much the Index Has Changed Since 2010
How to Calculate Stock Beta and Correlation in Python
← All articles

Which AI Chip Stocks Have Margin Momentum? Profitability Trend Analysis in Python

What's the question?

Artificial intelligence demand has lifted semiconductor revenue, but revenue growth does not tell the whole story. A chip company can grow quickly while losing pricing power, absorbing inventory costs, or spending heavily to support capacity. Margin momentum tests whether the incremental demand is becoming more profitable.

Gross margin is revenue minus cost of revenue, divided by revenue. It measures how much revenue remains after direct production costs. Operating margin goes further by subtracting operating expenses. Free-cash-flow margin measures how much revenue becomes cash after capital spending.

The question is which AI-exposed semiconductor companies are converting demand into better margins, and which are simply growing without additional profitability.

The approach

The universe is NVDA, AVGO, AMD, MU, QCOM, INTC, AMAT, and LRCX. Built from SEC EDGAR public filings and market data, the screen uses annual financial statements to compare the latest fiscal year with the prior fiscal year.

  1. Pull annual revenue, gross profit, operating income, and free cash flow
  2. Compute latest gross margin, operating margin, and free-cash-flow margin
  3. Compute revenue growth from the prior annual period
  4. Compute gross-margin change in percentage points
  5. Rank companies by gross-margin change

Annual data is used because it smooths quarter-specific shipment timing and makes the comparison more stable across companies with different fiscal calendars.

Code

import xfinlink as xfl
import pandas as pd

xfl.set_api_key("YOUR_API_KEY")  # free at https://xfinlink.com/signup

tickers = ["NVDA", "AVGO", "AMD", "MU", "QCOM", "INTC", "AMAT", "LRCX"]
fields = ["revenue", "gross_profit", "operating_income", "free_cash_flow"]
df = xfl.fundamentals(tickers, period_type="annual", period="5y", fields=fields)

rows = []
for ticker, group in df.sort_values(["ticker", "period_end"]).groupby("ticker"):
    latest = group.dropna(subset=fields).iloc[-1]
    prior = group.dropna(subset=fields).iloc[-2]
    latest_gross_margin = latest["gross_profit"] / latest["revenue"]
    prior_gross_margin = prior["gross_profit"] / prior["revenue"]
    rows.append({
        "ticker": ticker,
        "revenue_growth": latest["revenue"] / prior["revenue"] - 1,
        "gross_margin": latest_gross_margin,
        "gross_margin_change": latest_gross_margin - prior_gross_margin,
        "operating_margin": latest["operating_income"] / latest["revenue"],
        "fcf_margin": latest["free_cash_flow"] / latest["revenue"],
    })

print(pd.DataFrame(rows).sort_values("gross_margin_change", ascending=False))

Full script with formatting and visualisation: ai-chip-margin-momentum-python.py

Output

Gross margin change for AI-exposed semiconductor and semiconductor-equipment companies
=== AI Chip Margin Momentum Screen ===
Universe: 8 semiconductor and semiconductor-equipment stocks
Latest annual periods: 2025-06-29 to 2026-01-25
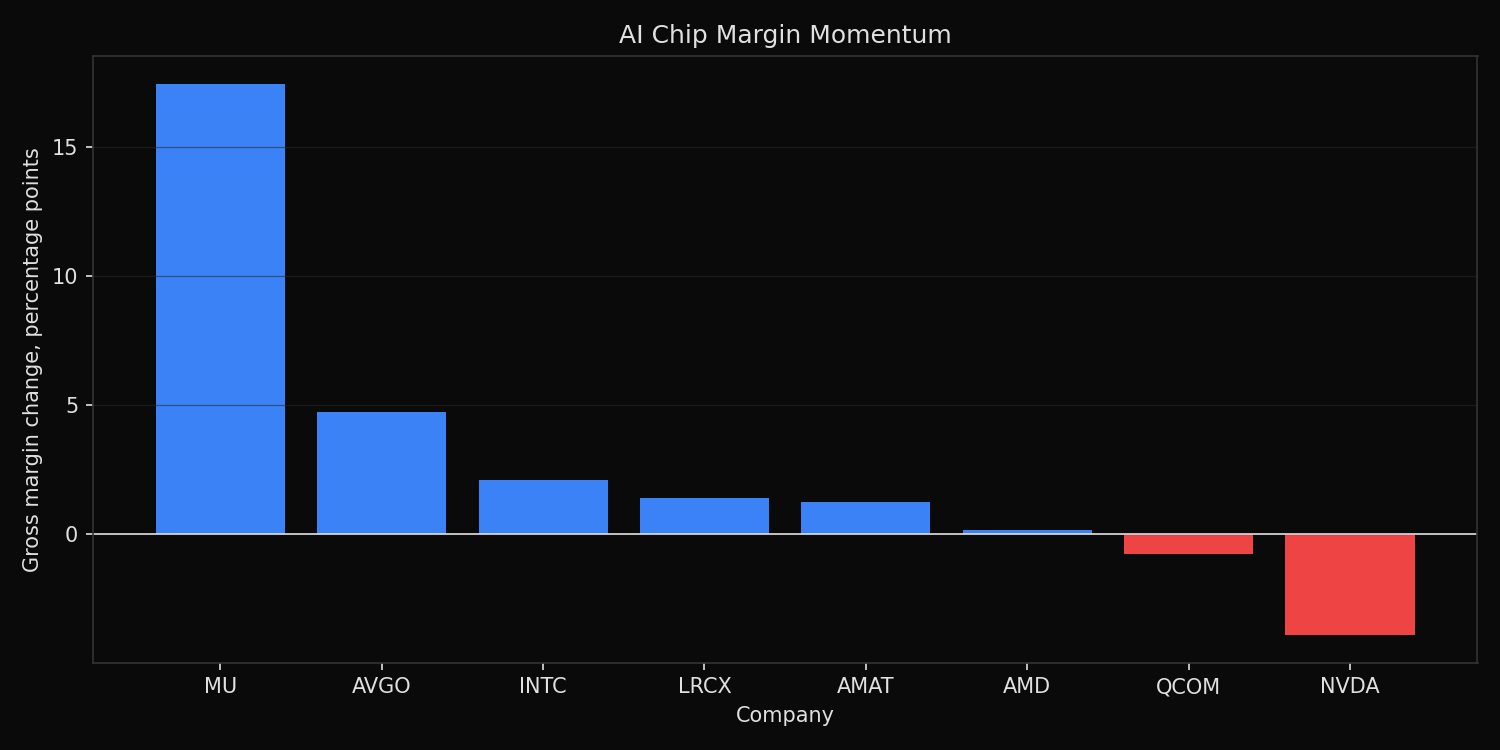
Best gross-margin expansion: MU +17.4pp
Median revenue growth: +23.8%

Margin ranking:
MU    revenue=$37.4B  rev_growth=+48.9%  gross_margin=39.8%  gross_margin_change=+17.4pp  op_margin=26.1%  FCF_margin= 4.5%
AVGO  revenue=$63.9B  rev_growth=+23.9%  gross_margin=67.8%  gross_margin_change= +4.7pp  op_margin=39.9%  FCF_margin=42.1%
INTC  revenue=$52.9B  rev_growth= -0.5%  gross_margin=34.8%  gross_margin_change= +2.1pp  op_margin=-4.2%  FCF_margin=-9.4%
LRCX  revenue=$18.4B  rev_growth=+23.7%  gross_margin=48.7%  gross_margin_change= +1.4pp  op_margin=32.0%  FCF_margin=29.4%
AMAT  revenue=$28.4B  rev_growth= +4.4%  gross_margin=48.7%  gross_margin_change= +1.2pp  op_margin=29.2%  FCF_margin=20.1%
AMD   revenue=$34.6B  rev_growth=+34.3%  gross_margin=49.5%  gross_margin_change= +0.2pp  op_margin=10.7%  FCF_margin=19.4%
QCOM  revenue=$44.3B  rev_growth=+13.7%  gross_margin=55.4%  gross_margin_change= -0.8pp  op_margin=27.9%  FCF_margin=28.9%
NVDA  revenue=$215.9B  rev_growth=+65.5%  gross_margin=71.1%  gross_margin_change= -3.9pp  op_margin=60.4%  FCF_margin=44.8%

What this tells us

MU has the strongest margin momentum in the group. Gross margin expanded by 17.4 percentage points while revenue grew 48.9%. That pattern is consistent with a memory-cycle recovery: revenue accelerates, fixed manufacturing costs are spread over more volume, and pricing improves from depressed levels.

NVDA remains the highest-quality business in absolute terms. It has 65.5% revenue growth, 71.1% gross margin, 60.4% operating margin, and 44.8% free-cash-flow margin. Its gross-margin change is negative because the prior-year margin was already exceptionally high. A decline from an extreme level is different from weak profitability.

INTC is the cautionary case. Gross margin improved by 2.1 percentage points, but revenue fell 0.5%, operating margin was negative, and free-cash-flow margin was negative. Margin improvement without positive operating profitability is not enough to confirm a durable recovery.

So what?

Margin momentum separates cyclical rebound from durable profitability. MU shows the largest improvement, but its free-cash-flow margin is still far below NVDA, AVGO, LRCX, AMAT, and QCOM. NVDA shows the strongest level of profitability, even though its margin change is negative.

For research, the next step is to classify each company by stage. MU is a recovery candidate. NVDA and AVGO are high-margin compounders. INTC is a turnaround that still needs proof in operating income and cash flow. The same AI demand theme can support all three, but each requires a different valuation framework.

Built with xfinlink — free financial data API for Python. pip install xfinlink

Built with xfinlink — free financial data API for Python. pip install xfinlink
← All articles