
What’s the question?
The payout ratio is the fraction of a company’s earnings handed to shareholders as dividends. A company earning $4.00 per share and paying $1.00 has a payout ratio of 25%. The remaining $3.00 stays inside the business.
The arithmetic appears to settle the matter. Cash paid out cannot be reinvested, so a company paying 70% of earnings has less than half the internal funding of one paying 30% and should grow more slowly. Textbooks call this the sustainable growth rate: return on equity times the retention ratio.
Robert Arnott and Clifford Asness tested the idea on aggregate US market data and found the reverse. Their 2003 paper in the Financial Analysts Journal, "Surprise! Higher Dividends = Higher Earnings Growth", showed that periods opening with a high market-wide payout ratio were followed by faster real earnings growth, and attributed it to governance: retained cash that management cannot deploy productively gets spent anyway. Aggregate history offers few independent windows; the open question is whether this holds company by company.
The approach
Two formation dates, each followed by five fiscal years of outcome.
- Take the point-in-time S&P 500 roster at 30 June 2015 and at 30 June 2020, so membership reflects what an investor could have observed. Companies are carried by entity id, so a reassigned ticker cannot enter.
- Read payout from the last fiscal year fully reported at each date, fiscal 2014 and fiscal 2019: dividends per share over diluted EPS from the same filing.
- Measure the outcome as total net income five fiscal years later against the base year. Per-share figures carry the share count in force at filing, so a five-year per-share series crossing a split is not on one scale. Total net income is, and it also keeps buybacks from flattering growth.
- Sort into six groups: no dividend, then 0-20%, 20-40%, 40-60%, 60-100%, and above 100%. Companies reporting a loss at formation have no meaningful payout ratio and are counted separately. Financials and Real Estate are set aside, where capital rules drive payout policy.
Hygiene runs first: fiscal year derived from the period end date rather than the reported label, one row per company-year picked on field coverage, diluted EPS times diluted shares required to reproduce net income within 10%, and a $50m floor on base-year net income.
Code
import numpy as np
import pandas as pd
from scipy import stats
import xfinlink as xfl

xfl.set_api_key("YOUR_API_KEY")  # free at https://xfinlink.com/signup

FIELDS = ["revenue", "net_income", "eps_diluted", "dividends_per_share",
          "dividends_paid", "weighted_avg_shares_diluted", "total_assets",
          "operating_cash_flow"]

rosters = {2014: xfl.index("sp500", as_of="2015-06-30"),
           2019: xfl.index("sp500", as_of="2020-06-30")}
universe = sorted({int(e) for r in rosters.values() for e in r["entity_id"]})

fun = xfl.fundamentals(entity_id=universe, period_type="annual",
                       start="2013-06-01", end="2026-06-30",
                       fields=FIELDS, max_rows=200000)
fun["period_end"] = pd.to_datetime(fun["period_end"])
fun["fy"] = np.where(fun["period_end"].dt.month <= 5,
                     fun["period_end"].dt.year - 1, fun["period_end"].dt.year)

# one row per company-year: the filing carrying the most primary fields
fun["filled"] = fun[FIELDS].notna().sum(axis=1)
fun = fun.sort_values(["entity_id", "fy", "filled", "filing_date"])
fun = fun.groupby(["entity_id", "fy"], as_index=False).tail(1)

# diluted EPS x diluted shares must reproduce net income to within 10%
ann = fun.dropna(subset=["revenue", "net_income", "eps_diluted",
                         "weighted_avg_shares_diluted"])
ann = ann[ann["weighted_avg_shares_diluted"] > 0]
implied = ann["eps_diluted"] * ann["weighted_avg_shares_diluted"] / ann["net_income"]
checked = ann[(implied - 1.0).abs() <= 0.10].copy()

rows = []
for base_fy in (2014, 2019):
    members = {int(e) for e in rosters[base_fy]["entity_id"]}
    base = checked[checked["entity_id"].isin(members) & (checked["fy"] == base_fy)]
    base = base[~base["gics_sector"].isin({"Financials", "Real Estate"})]
    end = checked.loc[checked["fy"] == base_fy + 5,
                      ["entity_id", "net_income", "revenue"]]
    end = end.rename(columns={"net_income": "ni_end", "revenue": "rev_end"})
    rows.append(base.merge(end, on="entity_id", how="left"))
panel = pd.concat(rows, ignore_index=True)

panel = panel[~(panel["dividends_per_share"].isna()
                & (panel["dividends_paid"].fillna(0) > 0))].copy()
panel["dividends_per_share"] = panel["dividends_per_share"].fillna(0.0)

form = panel[(panel["net_income"] >= 50.0) & (panel["eps_diluted"] > 0)].copy()
form["payout"] = form["dividends_per_share"] / form["eps_diluted"]
form["bucket"] = pd.cut(form["payout"], bins=[-1e-9, 0, .2, .4, .6, 1.0, 1e9],
                        labels=["No dividend", "0-20%", "20-40%", "40-60%",
                                "60-100%", "Above 100%"])

grown = form.dropna(subset=["ni_end"]).copy()
grown["growth"] = grown["ni_end"] / grown["net_income"] - 1.0
grown["rev_growth"] = grown["rev_end"] / grown["revenue"] - 1.0

print(grown.groupby("bucket", observed=True).agg(
    n=("growth", "size"), med_payout=("payout", "median"),
    earnings=("growth", "median"), mean=("growth", "mean"),
    revenue=("rev_growth", "median")))

payers = grown[grown["payout"] > 0]
normal = payers[payers["payout"] <= 1.0]
print(stats.spearmanr(payers["payout"], payers["growth"]))
print(stats.spearmanr(normal["payout"], normal["growth"]))
Full script with formatting and visualisation: does-high-payout-slow-earnings-growth-python.py
Output
Payout ratio and subsequent earnings growth, S&P 500
  company-years pulled                        7,133
  with revenue, earnings and a share count    6,976
  per-share figures reconcile within 10%       6,568
  index members outside Financials and Real Estate            737
  no per-share dividend figure to bucket          7
  loss-making or zero earnings at formation      40
  base-year net income under $50m               3
  companies entering the payout buckets         687

Five fiscal years of net income growth after formation (609 companies)

Payout at formation     n   Median    Median   Annual      Mean    Median  No FY+5
                            payout  earnings     ised  earnings   revenue   filing
----------------------------------------------------------------------------------
No dividend           110      0%     48.1%     8.2%    126.9%     47.1%       15
0-20%                  89     13%     13.8%     2.6%     35.3%     28.3%       10
20-40%                178     31%     35.1%     6.2%     28.6%     22.3%       22
40-60%                108     48%     25.4%     4.6%     21.9%     17.5%       17
60-100%                90     67%     29.8%     5.4%     39.1%     14.3%       10
Above 100%             34    153%    114.9%    16.5%     86.1%     16.6%        4

Rank correlation, payout against subsequent earnings growth
  all dividend payers          n=499  rho=+0.107  p=0.017
  payout of 100% or less       n=465  rho=+0.051  p=0.277

Median earnings growth by cohort
Payout at formation  FY2014-FY2019 FY2019-FY2024
No dividend                 48.7%        47.4%
0-20%                       14.9%         5.1%
20-40%                      22.5%        48.6%
40-60%                      25.1%        26.8%
60-100%                     47.0%        19.2%
Above 100%                 117.1%        93.1%
What this tells us
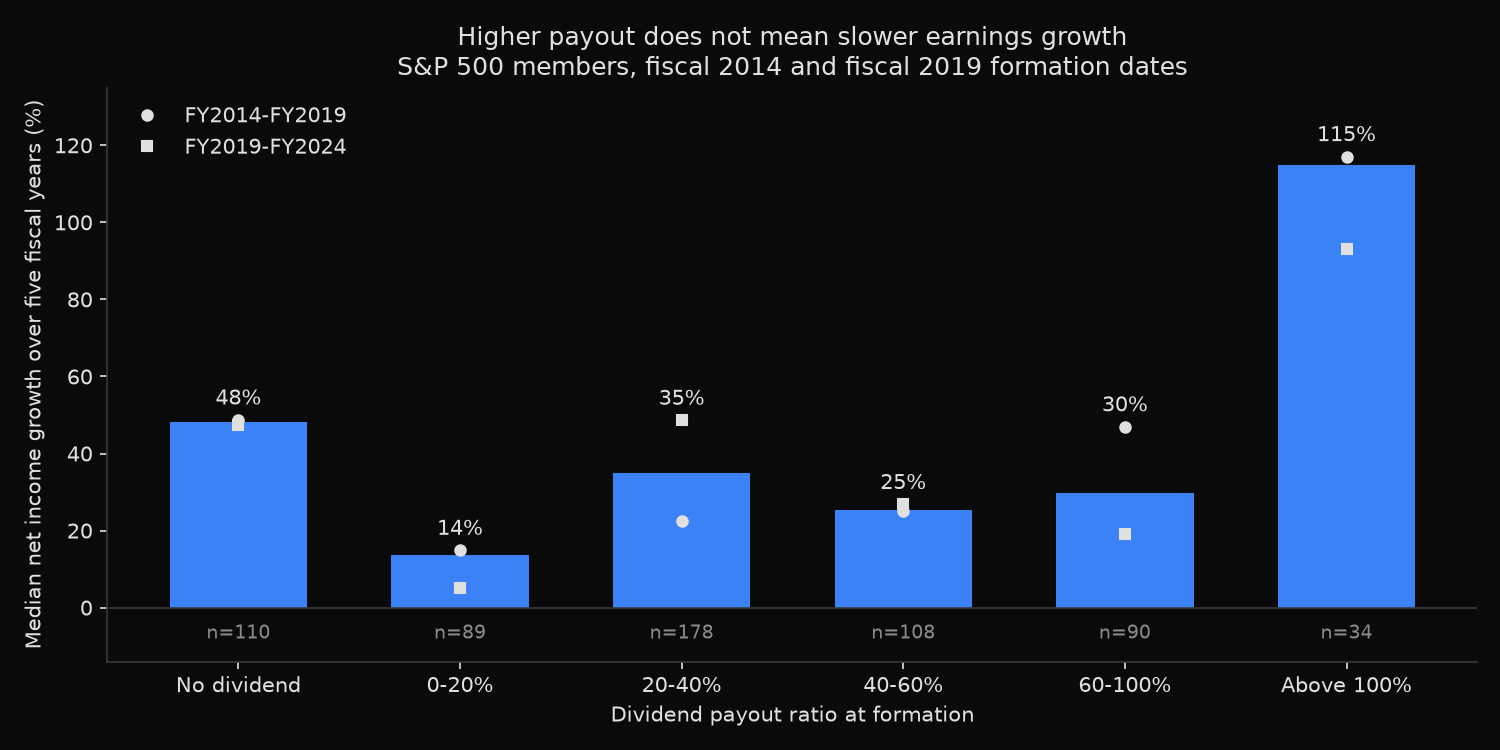
The textbook prediction does not appear. If retained earnings drove growth, the median column would fall from left to right across the four payer buckets below 100%. It reads 13.8%, 35.1%, 25.4%, 29.8%: the lowest growth belongs to the group paying least. Across all dividend payers the rank correlation between payout and later growth is +0.107 with a p-value of 0.017, positive rather than negative.
That tilt does not survive inspection. Removing the 34 companies that paid out more than they earned drops the correlation to +0.051 with a p-value of 0.277, indistinguishable from zero. The whole signal sits in that one group, which is no set of disciplined capital allocators: median revenue growth over the same five years was 16.6% against earnings growth of 114.9%. Earnings rose because the starting point was depressed. Chevron entered the fiscal 2019 cohort with diluted EPS of $1.54 against a $4.76 dividend, and Procter & Gamble with $1.43 after the Gillette writedown.
The revenue column tells a cleaner story. Median five-year revenue growth falls monotonically as payout rises: 47.1% for non-payers, then 28.3%, 22.3%, 17.5%, and 14.3%. Payout ratio marks how fast a business grows its sales, and stops being informative one line further down the income statement, because the slower-growing high payers expanded margins enough to close the gap.
So what?
Payout ratio should not be used as a negative screen on earnings growth. Two five-year windows covering 609 S&P 500 companies show no penalty for paying out, and the positive relationship that does appear comes from depressed-earnings recoveries rather than from capital allocation.
The ratio remains useful for what it measures. As a prior on revenue growth it is monotone and well behaved, so a cash flow model keying top-line assumptions to dividend policy has support; one keying earnings growth to the retention ratio does not.
Screening for payout above 100% selects companies in an impaired year, which makes it a workable recovery filter, though for the opposite reason a growth investor would assume. The wider lesson applies to any ratio built on a cyclical accounting figure: sort on it, then ask whether the groups differ in the numerator, the denominator, or both. Here it was mostly the denominator, and finding that out took one extra column of revenue growth.
Built with xfinlink — free financial data API for Python.