
What's the question?
Falling oil prices redistribute wealth across the economy. Companies with heavy fuel and energy costs — airlines, trucking, logistics — see their margins expand when crude drops. Companies that produce or sell oil see the opposite. The question is which stocks have the strongest inverse relationship with oil, and how reliable that relationship is.
Oil beta quantifies this. It is the slope coefficient from regressing a stock's daily returns on the daily returns of an oil price proxy. A negative oil beta means the stock tends to rise when oil falls. A beta of −0.28 means that for every 1% decline in oil, the stock rises approximately 0.28% on average. R-squared measures how much of the stock's daily return variance is explained by oil alone — a low R-squared indicates that oil is one factor among many, while a high R-squared suggests oil dominates the stock's price behavior.
With oil prices declining sharply in mid-2026 even amid geopolitical tensions in the Strait of Hormuz, identifying the highest-conviction oil beneficiaries is directly relevant to portfolio positioning.
The approach
The screen covers 12 stocks across four sectors that are commonly cited as oil-sensitive: airlines (DAL, UAL, LUV, AAL), logistics (FDX, UPS), retail and e-commerce (AMZN, WMT, TGT, HD, COST), and hotels (MAR). USO, the United States Oil Fund ETF, serves as the oil price proxy.
- Pull 3 years of daily returns for all 12 stocks and USO
- For each stock, run an ordinary least squares regression of its daily returns on USO daily returns
- Extract the slope (oil beta), R-squared, and p-value from each regression
- Rank all 12 stocks from most negative oil beta to most positive
Three years of daily data provides approximately 750 observations per stock — sufficient for stable regression estimates while capturing multiple oil price regimes.
Code
import xfinlink as xfl
import pandas as pd
from scipy import stats

xfl.set_api_key("YOUR_API_KEY")  # free at https://xfinlink.com/signup

sectors = {
    "DAL": "Airlines", "UAL": "Airlines", "LUV": "Airlines", "AAL": "Airlines",
    "FDX": "Logistics", "UPS": "Logistics",
    "AMZN": "E-Commerce", "WMT": "Retail", "TGT": "Retail",
    "HD": "Retail", "COST": "Retail", "MAR": "Hotels",
}

tickers = list(sectors.keys()) + ["USO"]
df = xfl.prices(tickers, period="3y", fields=["close", "return_daily"])

uso = df[df["ticker"] == "USO"].sort_values("date").set_index("date")["return_daily"].dropna()
results = []
for ticker in sectors:
    stock = df[df["ticker"] == ticker].sort_values("date").set_index("date")["return_daily"].dropna()
    merged = pd.concat([stock.rename("stock"), uso.rename("uso")], axis=1).dropna()
    slope, intercept, r_value, p_value, std_err = stats.linregress(merged["uso"], merged["stock"])
    results.append({"Ticker": ticker, "Sector": sectors[ticker],
                     "Oil Beta": round(slope, 4), "R²": round(r_value**2, 4),
                     "p-value": round(p_value, 6)})

results_df = pd.DataFrame(results).sort_values("Oil Beta")
print(results_df.to_string(index=False))
Full script with formatting and visualisation: oil-beta-beneficiaries-screen-python.py
Output
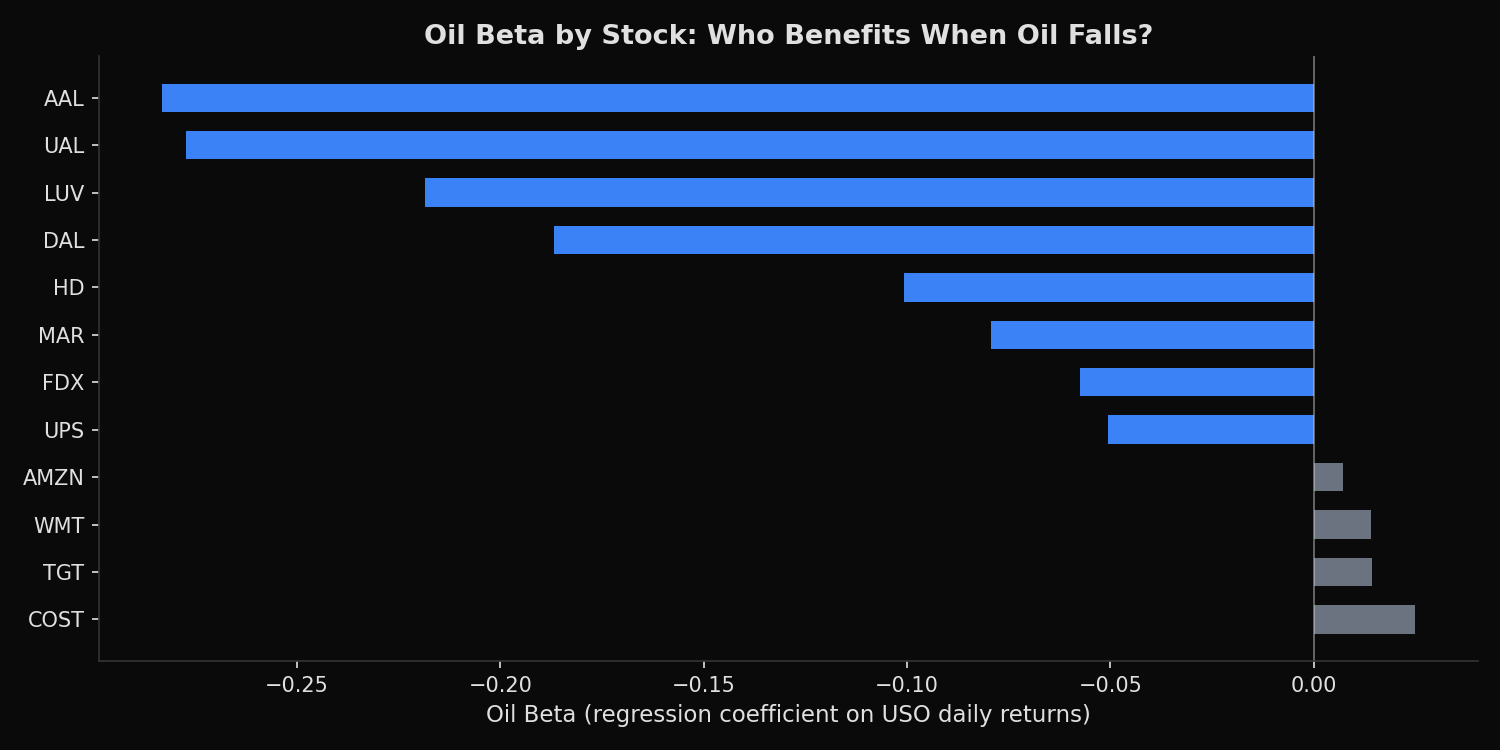
Observation period: 2023-07-11 to 2026-07-09
Daily observations per stock: ~752
Oil proxy: USO (United States Oil Fund ETF)

Ticker   Sector         Oil Beta       R²    p-value
----------------------------------------------------
AAL      Airlines        -0.2833   0.0440   0.000000 ***
UAL      Airlines        -0.2774   0.0392   0.000000 ***
LUV      Airlines        -0.2186   0.0356   0.000000 ***
DAL      Airlines        -0.1869   0.0261   0.000009 ***
HD       Retail          -0.1008   0.0251   0.000013 ***
MAR      Hotels          -0.0794   0.0121   0.002482 **
FDX      Logistics       -0.0574   0.0038   0.089417
UPS      Logistics       -0.0506   0.0038   0.091857
AMZN     E-Commerce       0.0072   0.0001   0.823145
WMT      Retail           0.0142   0.0005   0.534580
TGT      Retail           0.0143   0.0002   0.694378
COST     Retail           0.0249   0.0019   0.233154
What this tells us
Airlines dominate the screen. All four carriers have statistically significant negative oil betas (p < 0.001). AAL and UAL lead at −0.28 and −0.28 respectively, meaning a 10% drop in oil is associated with a roughly 2.8% gain in these stocks. LUV follows at −0.22, and DAL at −0.19. The ordering reflects cost structure: AAL and UAL have weaker balance sheets and thinner margins, so fuel cost savings translate into proportionally larger earnings swings.
Home Depot (HD) is the surprise of the screen. Its oil beta of −0.10 is statistically significant (p < 0.001) and stronger than both logistics names. HD's sensitivity likely runs through two channels: lower diesel costs reduce distribution expenses, and falling fuel prices leave consumers with more disposable income for home improvement spending.
Marriott (MAR) shows a moderate negative oil beta of −0.08 (p = 0.002). Hotels benefit from lower energy costs directly and from increased consumer travel spending when fuel prices decline.
FDX and UPS have negative betas (−0.06 and −0.05) but are not statistically significant at the 5% level (p = 0.09 for both). Their fuel surcharge mechanisms partially hedge oil exposure, muting the relationship.
The four general retailers — AMZN, WMT, TGT, and COST — show oil betas near zero, none statistically significant. These companies do benefit from lower fuel costs, but the effect is spread across massive revenue bases and offset by other factors that drive their returns.
R-squared values are modest across the board, ranging from 0.00 to 0.04. Oil explains at most 4.4% of daily return variance even for the most oil-sensitive airline. This is expected: individual stock returns are driven by earnings surprises, sector rotation, market beta, and idiosyncratic news. Oil is a meaningful factor but far from the only one.
So what?
For investors positioning around an oil price decline, airlines offer the most concentrated exposure. AAL and UAL provide the largest beta but also carry the most credit risk — their sensitivity to oil is amplified by financial leverage. DAL offers a cleaner trade: lower oil beta but a stronger balance sheet, making it a more reliable beneficiary without the balance-sheet tail risk.
HD is worth attention as a less obvious oil beneficiary. Its negative oil beta is statistically robust and its consumer-spending channel provides diversification away from the pure fuel-cost thesis.
The logistics names (FDX, UPS) are not effective oil hedges despite the intuitive appeal. Their fuel surcharge pass-through mechanisms neutralize much of the benefit. General retailers (WMT, COST, TGT, AMZN) show no meaningful oil sensitivity in their daily returns — the relationship, if it exists, operates on longer time horizons through consumer spending channels that are not captured in a daily regression.
One important caveat: oil beta is not static. These coefficients are estimated over a 3-year window. Structural changes — new hedging policies, fleet efficiency programs, or shifts in business mix — can alter a company's oil sensitivity over time. A rolling-window analysis would reveal whether these betas are stable or drifting. How far a market beta estimated over one window carries into the next is the question behind beta stability testing on two-year windows.
Built with xfinlink — free financial data API for Python.