
How Long Does an S&P 500 Membership Last? Kaplan-Meier Survival Analysis in Python
September 16, 2026
What’s the question?
A company joins the S&P 500. How long does it stay?
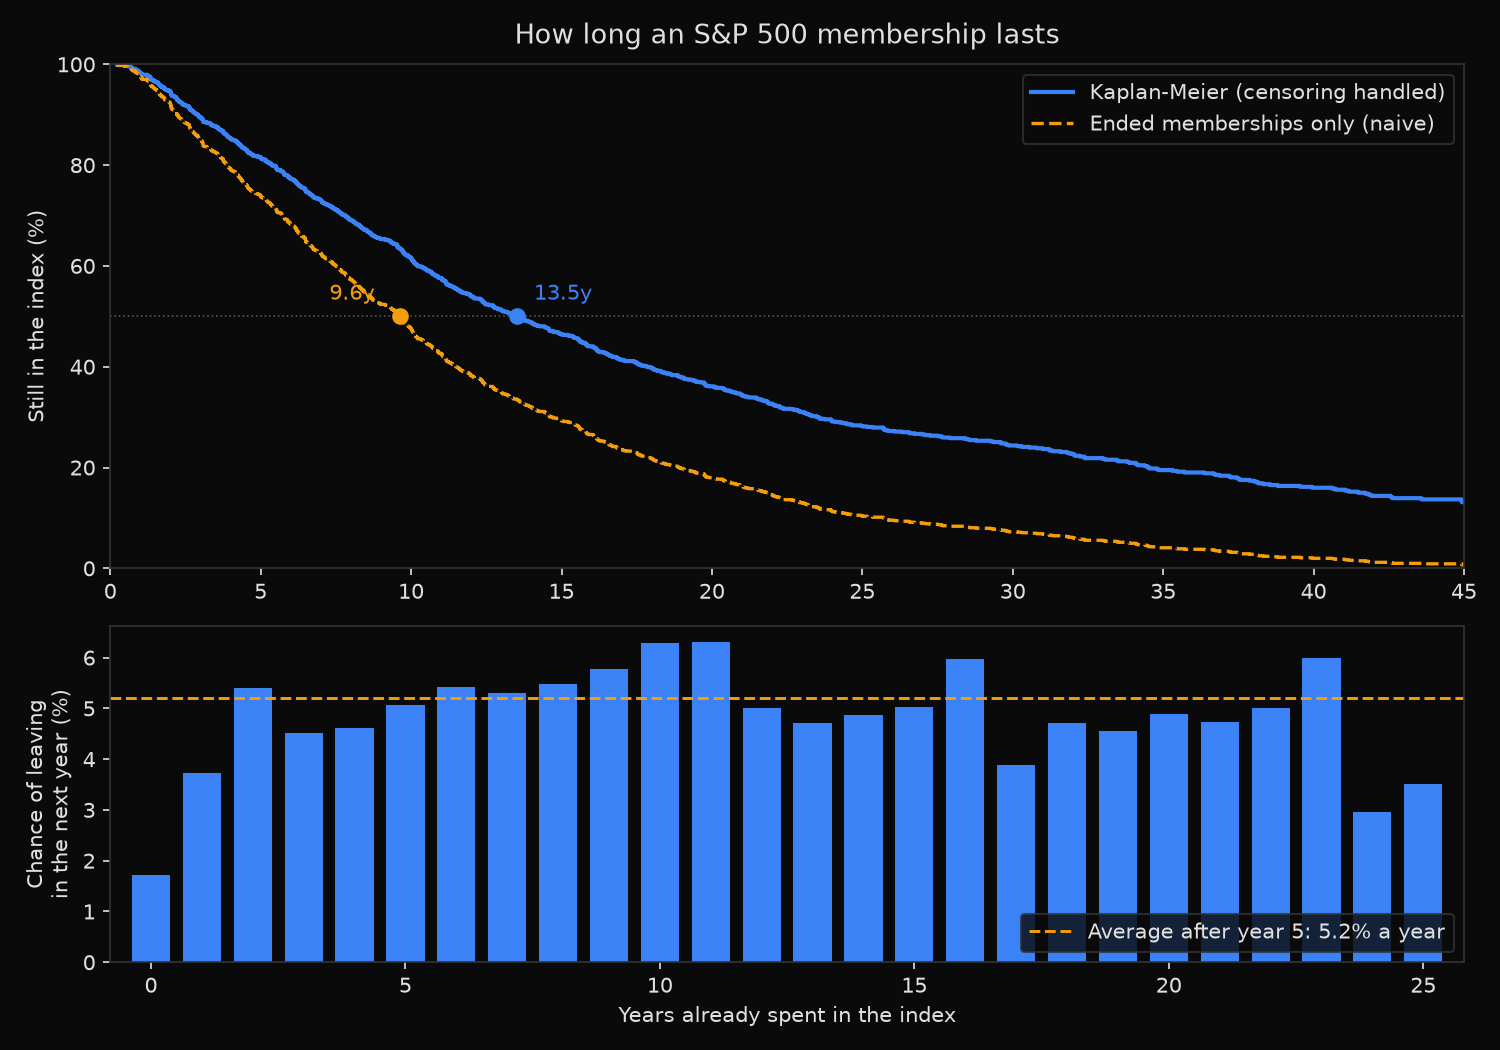
The obvious answer lists every company that has already left, measures how long each stayed, and takes the middle value. That returns 9.6 years, and it is wrong in a predictable direction. The problem is the companies that have not left. Texas Instruments joined in March 1959 and is still a member 67 years later; its membership has no end date, so it contributes nothing to any statistic built on end dates, and gets dropped for the very reason it is worth counting. Statisticians call this right-censoring: 67 years without an ending is evidence of durability, not an absence of it.
Kaplan-Meier repairs the estimate. Instead of averaging finished durations, it steps through tenure one exit at a time, asking how many of the companies still under observation at that point left next. A still-running membership counts in the denominator for every year it has been watched, then leaves the risk set without ever counting as an exit.
That makes a second question answerable: does exit risk depend on tenure already served? The hazard rate measures the chance of leaving in the next year, given survival so far.
The approach
The event log holds 3,019 dated additions and removals between 4 March 1957 and 7 May 2026. Every still-running spell is censored at that last date.
- Page the full event log with
index_events, 1,000 rows per request. - Convert the log into spells. Two listed share classes generate two additions, so the reconstruction counts open listings and closes a spell only when the last is removed. Alphabet, added in 2006 and again in 2014, resolves to one membership.
- Censor a spell only when the company appears in the roster returned by
index(). - Exclude the 434 removals with no opening addition. Founding-roster additions are suppressed by design, recording who was already a member when the log opens, so those removals cannot form a complete spell.
- Exclude the 28 spells under 30 days, each a spin-off placed in the index on its distribution date for price discovery, then removed once a price is known.
- Fit Kaplan-Meier to the remaining 1,462 spells and compute the annual hazard within tenure bands.
- Refit by joining decade, with a log-rank test on pre-1990 against 2000-onward joiners. No cohort reports survival past its own follow-up.
Code
import numpy as np
import pandas as pd
import xfinlink as xfl
from statsmodels.duration.survfunc import SurvfuncRight, survdiff

xfl.set_api_key("YOUR_API_KEY")  # free at https://xfinlink.com/signup

frames, offset = [], 0
while True:
    page = xfl.index_events("SP500", start="1957-01-01", limit=1000, offset=offset)
    if page.empty:
        break
    frames.append(page)
    offset += len(page)
    if len(page) < 1000:
        break

events = pd.concat(frames, ignore_index=True)
events["effective_date"] = pd.to_datetime(events["effective_date"])
log_end = events["effective_date"].max()
events = events.dropna(subset=["entity_id"]).copy()
events["entity_id"] = events["entity_id"].astype(int)
events = events.sort_values(["entity_id", "effective_date", "event_type"],
                            kind="mergesort")

# two share classes means two additions, so close a spell only when the
# last open listing is removed
spells = []
for entity_id, g in events.groupby("entity_id"):
    depth, start = 0, None
    for _, row in g.iterrows():
        if row["event_type"] == "added":
            if depth == 0:
                start = row["effective_date"]
            depth += 1
        elif depth > 0:
            depth -= 1
            if depth == 0:
                spells.append((entity_id, start, row["effective_date"]))
    if depth > 0:  # still a member: right-censored
        spells.append((entity_id, start, pd.NaT))

sp = pd.DataFrame(spells, columns=["entity_id", "added", "removed"])

# a spell counts as censored only if the company is in the roster as it stands
roster = xfl.index("sp500")
sp = sp[sp["removed"].notna() | sp["entity_id"].isin(set(roster["entity_id"]))]
sp["days"] = (sp["removed"].fillna(log_end) - sp["added"]).dt.days
sp = sp[sp["days"] >= 30].copy()          # spin-off placements are not memberships
sp["exited"] = sp["removed"].notna().astype(int)
sp["years"] = sp["days"] / 365.25

km = SurvfuncRight(sp["years"], sp["exited"])
median = km.surv_times[km.surv_prob <= 0.5][0]
naive_median = sp.loc[sp["exited"] == 1, "years"].median()

# annual hazard: exits in a tenure year divided by the companies that reached it
haz = []
for y in range(26):
    at_risk = int((sp["years"] >= y).sum())
    exits = int(((sp["exited"] == 1) & (sp["years"].between(y, y + 1, "left"))).sum())
    haz.append((y, at_risk, exits, exits / at_risk))
haz = pd.DataFrame(haz, columns=["year", "at_risk", "exits", "rate"])

sp["decade"] = (sp["added"].dt.year // 10) * 10
grp = np.where(sp["decade"] < 1990, 0, np.where(sp["decade"] >= 2000, 1, 2))
chi2, pval = survdiff(sp["years"][grp < 2], sp["exited"][grp < 2], grp[grp < 2])

print(f"Kaplan-Meier median {median:.1f}y vs naive {naive_median:.1f}y")
print(haz.groupby(haz["year"] // 5).apply(
    lambda b: b["exits"].sum() / b["at_risk"].sum()))
print(f"log-rank chi2={chi2:.2f} p={pval:.4f}")
Full script with formatting and visualisation: sp500-membership-kaplan-meier-hazard-python.py
Output
=== S&P 500 membership tenure: Kaplan-Meier survival ===
Event log: 3019 events, 1957-03-04 to 2026-05-07. Spells: 1462 (1006 ended, 456 still running)
Removals not matched to a complete spell: 434. Spells under 30 days excluded: 28

Kaplan-Meier median tenure : 13.5 years
Naive median, ended spells : 9.6 years  (understates by 3.9y, 29%)
Naive mean,   ended spells : 12.1 years

Tenure    Survived   Left by then
  1 years      98.3%         1.7%
  3 years      89.4%        10.6%
  5 years      81.4%        18.6%
 10 years      61.5%        38.5%
 15 years      46.4%        53.6%
 20 years      36.1%        63.9%
 25 years      28.3%        71.7%

Annual chance of leaving, by how long the company has already been in
Tenure band    At risk   Exits   Hazard per year
 0-1  years       2881      78         2.71%
 2-4  years       3803     185         4.86%
 5-9  years       4917     265         5.39%
10-14 years       3345     184         5.50%
15-19 years       2326     113         4.86%
20-25 years       1852      85         4.59%

Flat-hazard benchmark: at 5.20% a year, half a cohort is gone after ln(2)/h = 13.3 years
Kaplan-Meier median actually observed: 13.5 years

Joining cohort by decade
Decade    Spells   Ended   5y surv   10y surv   Median
1950s         31      29     90.3%      67.7%     18.1y
1960s        177     167     83.6%      61.6%     14.5y
1970s        192     170     84.4%      68.8%     15.4y
1980s        244     197     82.4%      66.4%     14.5y
1990s        216     155     76.4%      56.9%     12.9y
2000s        285     194     81.8%      55.8%     11.7y
2010s        211      80     80.1%      61.4%       n/r
2020s        106      14     74.3%        n/e       n/r
n/e: follow-up does not yet reach that horizon. n/r: median not yet reached.

Log-rank, pre-1990 joiners vs 2000+ joiners: chi2=2.14, p=0.1436

--- validation ---
Negative or zero durations: 0
Open spells not in the roster: 0
Additions 1501, removals 1473
Years 0-1 hazard with short spells put back in: 3.58% per year
Longest running memberships: FE 69y, TXN 67y, BKR 64y, WY 62y, SHW 62y
What this tells us
The median S&P 500 membership runs 13.5 years. Counting only finished memberships gives 9.6, understating it by 29%; the gap is the 456 memberships still running, which are disproportionately the durable ones. On the corrected curve 18.6% of entrants are gone inside five years, 38.5% within ten.
The hazard bands carry the more useful result. After the first couple of years the annual chance of leaving settles between 4.59% and 5.50% and stays there through year 25, with no drift in either direction. Membership does not wear out; tenure served says almost nothing about tenure remaining. A constant 5.20% rate would imply a median of ln(2)/0.052 = 13.3 years, against the 13.5 the estimator found.
The exception sits at the start. Exit risk across years zero and one runs 2.71% a year, about half the later rate, and stays below the plateau at 3.58% even with the short spin-off placements added back. New entrants are the safest group in the index, which follows from how they got in: the intake has just cleared the eligibility screens; the incumbent it replaced had not.
Across joining decades the median falls from 14.5 years for 1960s entrants to 11.7 for the 2000s, but the log-rank test returns p = 0.1436. The direction is consistent; the evidence does not establish it. That question is taken up directly, with censoring-free fixed-horizon survival rates in place of the estimator used here, in Are Companies Leaving the S&P 500 Faster Than They Used To?
So what?
Any duration statistic computed only on completed cases carries the same 29% bias. Average holding period, median time to default, mean customer lifetime: each breaks the same way when the unfinished cases are dropped. Ask whether the denominator includes the cases that have not finished; if not, the number falls as the population grows younger regardless of what is happening underneath.
For index research the flat hazard is the operational finding. Turnover models that assume a seasoning effect, where recently added names churn faster, have it backwards. Past year two, assume a constant 5% annual exit probability per name and a memoryless duration, which puts expected remaining tenure near 19 years for any current constituent regardless of time served. That single parameter sizes a rebalancing budget or sets the decay on a membership-conditioned signal.
The distinction that matters is between an entrant and an incumbent, not between a young incumbent and an old one.
Built with xfinlink — free financial data API for Python. pip install -U xfinlink
pip install -U xfinlink