
What’s the question?
Goodwill is the premium an acquirer pays above the fair value of the identifiable assets and liabilities it buys. It goes onto the balance sheet at cost. US accounting does not amortise goodwill; the balance stays untouched until management accepts that the acquisition will not earn back what was paid, and that acceptance arrives as one charge, frequently for billions.
A large goodwill balance is therefore a stock of acquisition losses that has not yet been recognised. Kraft Heinz carried $44.8bn at the end of 2017 and reported a $15.9bn impairment in 2018. The question is whether the size of the balance says anything about when the charge arrives. How often restructuring and impairment charges recur at a single company is the question behind a charge-frequency analysis.
The approach
- Universe: the union of point-in-time S&P 500 rosters at each year end from 2012 to 2024, retrieved through
as_ofand carried by entity id, so a company that later left the index stays in the sample for the years it was a member. Studying current members alone would drop the companies whose acquisitions failed badly enough to cost them the seat. - Financials and Real Estate are set aside, because goodwill against total assets means something different on a balance sheet dominated by loan books and investment property.
- The signal at each fiscal year end is goodwill divided by total assets.
- A material writedown is a fiscal year in which goodwill falls by at least 1 per cent of prior-year total assets and the reported impairment charge reaches 0.5 per cent of them. Both have to hold, since a divestiture moves the balance without an impairment and a plant writedown produces a charge without moving it.
- Rows satisfy the identity that goodwill cannot exceed total assets; companies without a full three-year forward window drop from the cohort.
That leaves 4,893 company-years from 549 companies, signal years 2012 to 2021.
Code
import numpy as np
import pandas as pd
import statsmodels.api as sm
import xfinlink as xfl

xfl.set_api_key("YOUR_API_KEY")  # free at https://xfinlink.com/signup

YEARS = list(range(2012, 2025))
FIELDS = ["goodwill", "impairment_charges", "total_assets", "total_equity"]

ids = set()
for y in YEARS:
    ids |= set(xfl.index("sp500", as_of=f"{y}-12-31")["entity_id"])

excluded = set()
for sector in ["Financials", "Real Estate"]:
    offset = 0
    while True:
        page = xfl.search(gics_sector=sector, limit=500, offset=offset)
        excluded |= set(page["entity_id"])
        if len(page) < 500:
            break
        offset += 500
universe = sorted(int(i) for i in (ids - excluded))

p = pd.concat([xfl.fundamentals(entity_id=universe[i:i + 25], period_type="annual",
                                fields=FIELDS, start="2011-01-01", end="2025-12-31",
                                max_rows=200000)
               for i in range(0, len(universe), 25)], ignore_index=True)

p["fy"] = np.where(p["period_end"].dt.month >= 6,
                   p["period_end"].dt.year, p["period_end"].dt.year - 1)
p = p.sort_values("period_end").drop_duplicates(["entity_id", "fy"], keep="last")
p["goodwill"] = p["goodwill"].fillna(0.0)   # a company that reports none carries none
p = p[(p["total_assets"] >= 100) & (p["goodwill"] >= 0)
      & (p["goodwill"] <= p["total_assets"])]

grp = p.groupby("entity_id")
p["gw_prev"], p["ta_prev"] = grp["goodwill"].shift(1), grp["total_assets"].shift(1)
p["gw_fall"] = (p["gw_prev"] - p["goodwill"]) / p["ta_prev"]
p["charge_ta"] = p["impairment_charges"].abs() / p["ta_prev"]
p["writedown"] = (p["gw_fall"] >= 0.01) & (p["charge_ta"] >= 0.005)

fwd = p[["entity_id", "fy", "writedown"]]
d = p[p["fy"].between(2012, 2021)].copy()
d["gw_int"] = d["goodwill"] / d["total_assets"]
for k in (1, 2, 3):
    nxt = fwd.assign(fy=fwd["fy"] - k).rename(columns={"writedown": f"wd{k}"})
    d = d.merge(nxt, on=["entity_id", "fy"], how="left", indicator=f"seen{k}")
d = d[(d["seen1"] == "both") & (d["seen2"] == "both") & (d["seen3"] == "both")]
d["wd3y"] = d[["wd1", "wd2", "wd3"]].fillna(False).any(axis=1)

d["q"] = d.groupby("fy")["gw_int"].transform(
    lambda s: pd.qcut(s.rank(method="first"), 5, labels=[1, 2, 3, 4, 5]).astype(int))
print(d.groupby("q").agg(n=("wd3y", "size"), med_int=("gw_int", "median"),
                         rate3=("wd3y", "mean")))

model = sm.Logit(d["wd3y"].astype(int), sm.add_constant(pd.DataFrame({
    "gw_int": d["gw_int"], "log_assets": np.log(d["total_assets"])}))).fit()
print(model.summary2().tables[1])
Full script with formatting and visualisation: does-large-goodwill-predict-writedowns-python.py
Output
Point-in-time S&P 500 rosters 2012-2024, Financials and Real Estate excluded
  company-years pulled: 7,684   after plausibility screen: 7,626
  cohort company-years with a full 3-year forward window: 4,893 from 549 companies
  material writedown events in the panel: 407
  base rate, any writedown within 3 years: 14.0%

Goodwill / total assets quintile at fiscal year end
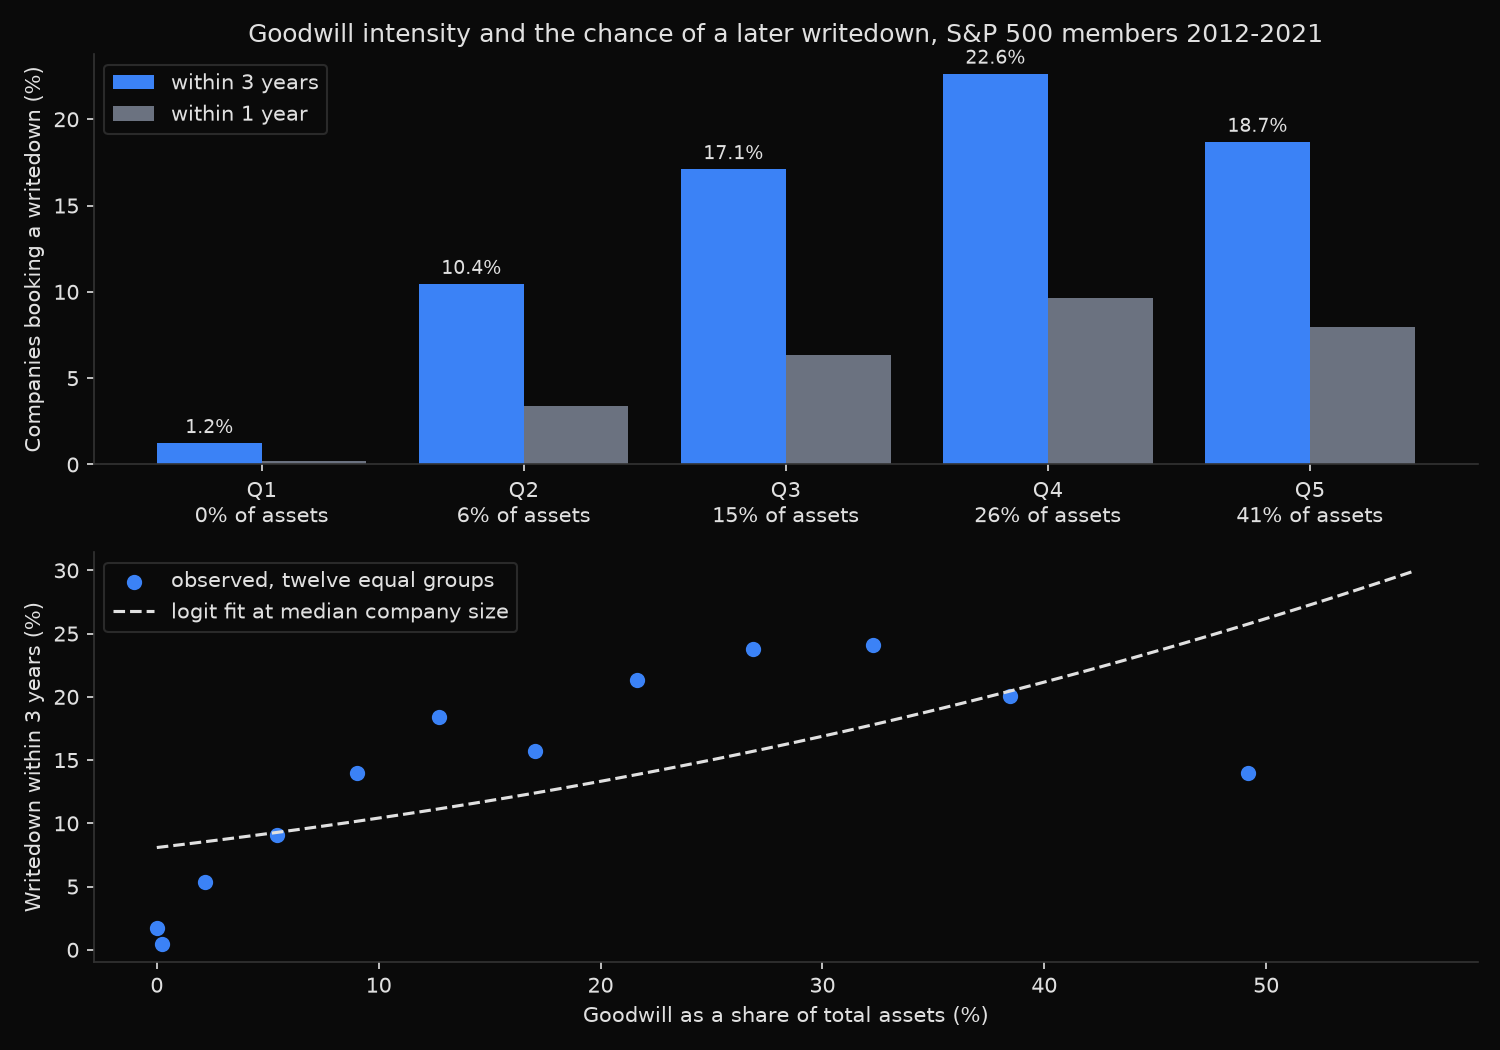
  q   n     median goodwill/assets   writedown 1y   writedown 3y   strict 3y   median charge (% of assets)
  Q1  982          0.000              0.2%           1.2%         0.6%            5.6%
  Q2  977          0.058              3.4%          10.4%         7.2%            3.5%
  Q3  977          0.148              6.3%          17.1%        11.8%            3.8%
  Q4  977          0.264              9.6%          22.6%        12.0%            3.3%
  Q5  980          0.407              8.0%          18.7%        12.4%            2.5%

  goodwill under 1% of assets: 845 company-years, 3-year writedown rate 1.1%
  goodwill at or above 1%:     4,048 company-years, 3-year writedown rate 16.7%

Logit, writedown within 3 years
             Coef.  Std.Err.        z  P>|z|  [0.025  0.975]
const      -4.8846    0.3387 -14.4203    0.0 -5.5485 -4.2207
gw_int      2.7897    0.2559  10.9018    0.0  2.2881  3.2912
log_assets  0.2602    0.0333   7.8034    0.0  0.1948  0.3255
  pseudo R-squared 0.0437, n 4,893
  fitted probability at median company size: 9.2% when goodwill is 5% of assets, 21.2% when it is 40%
  Q4 minus Q5 three-year rate: +3.9 points, z = 2.16

Largest events by dollar charge
  GM     FY2012  goodwill    29,019 ->     1,973   charge    31,310m (21.7% of assets)
  T      FY2022  goodwill    92,740 ->    67,895   charge    24,812m (4.5% of assets)
  GE     FY2018  goodwill    58,821 ->    33,974   charge    22,136m (6.0% of assets)
  HPQ    FY2012  goodwill    44,551 ->    31,069   charge    20,418m (15.8% of assets)
  DVN    FY2015  goodwill     6,303 ->     3,337   charge    17,647m (34.9% of assets)
  KHC    FY2018  goodwill    44,825 ->    36,503   charge    15,936m (13.3% of assets)
  WBA    FY2024  goodwill    28,187 ->    15,506   charge    12,701m (13.1% of assets)
  SLB    FY2020  goodwill    16,042 ->    12,980   charge    12,554m (22.3% of assets)
What this tells us
The base rate is 14.0 per cent: one company-year in seven is followed by a material goodwill writedown inside three fiscal years. Almost all of the predictive content sits at the bottom of the distribution. The lowest quintile carries essentially no goodwill and books a writedown 1.2 per cent of the time; the second quintile, whose median company carries goodwill worth 5.8 per cent of assets, books one 10.4 per cent of the time. A fixed 1 per cent cut says the same thing: 1.1 per cent against 16.7 per cent. The informative step is from no acquisitions to some.
Past that step the gradient flattens, then reverses. Three-year rates run 10.4, 17.1 and 22.6 per cent through the second, third and fourth quintiles before the top quintile falls back to 18.7 per cent, 3.9 points below the fourth (z = 2.16). Companies holding goodwill worth more than 40 per cent of assets are not the ones most likely to write it off; many are serial acquirers for whom buying businesses is the operating model.
The regression finds the same shape. Goodwill intensity carries a coefficient of 2.79 against a standard error of 0.26, while the pseudo R-squared of 0.0437 rules out a forecast. At median company size the fitted probability moves from 9.2 per cent at 5 per cent intensity to 21.2 per cent at 40 per cent, so four in five heavily acquisitive companies pass three years without a material charge.
Severity runs against frequency: the median charge, conditional on an event, falls from 5.6 per cent of assets in the lowest quintile to 2.5 per cent in the highest. Companies with little goodwill impair rarely, and heavily when they do, while AT&T’s $24.8bn charge in 2022 came to 4.5 per cent of its assets.
So what?
Treat goodwill intensity as a hazard flag, not a ranking. Its value is exclusionary: a company whose goodwill is under 1 per cent of assets faces roughly a one-in-a-hundred chance of a writedown over three years and can be set aside. Once goodwill passes roughly a tenth of assets the risk settles between 17 and 23 per cent and stays there, so sorting inside that group adds little.
For a position that depends on reported book value, run a scenario rather than a probability. Remove 3 per cent of total assets from book equity, the median observed charge in the quintiles where most events occur, then check the price-to-book screen, the tangible equity ratio and any covenant written against net worth. Writedowns are non-cash, so the response to a flagged holding is to size it for a book-value shock rather than to sell on the flag.
Built with xfinlink — free financial data API for Python.