
Is AI Spending Crowding Out Free Cash Flow? Capex Sustainability Across the Mag 7 in Python
May 20, 2026
What’s the question?
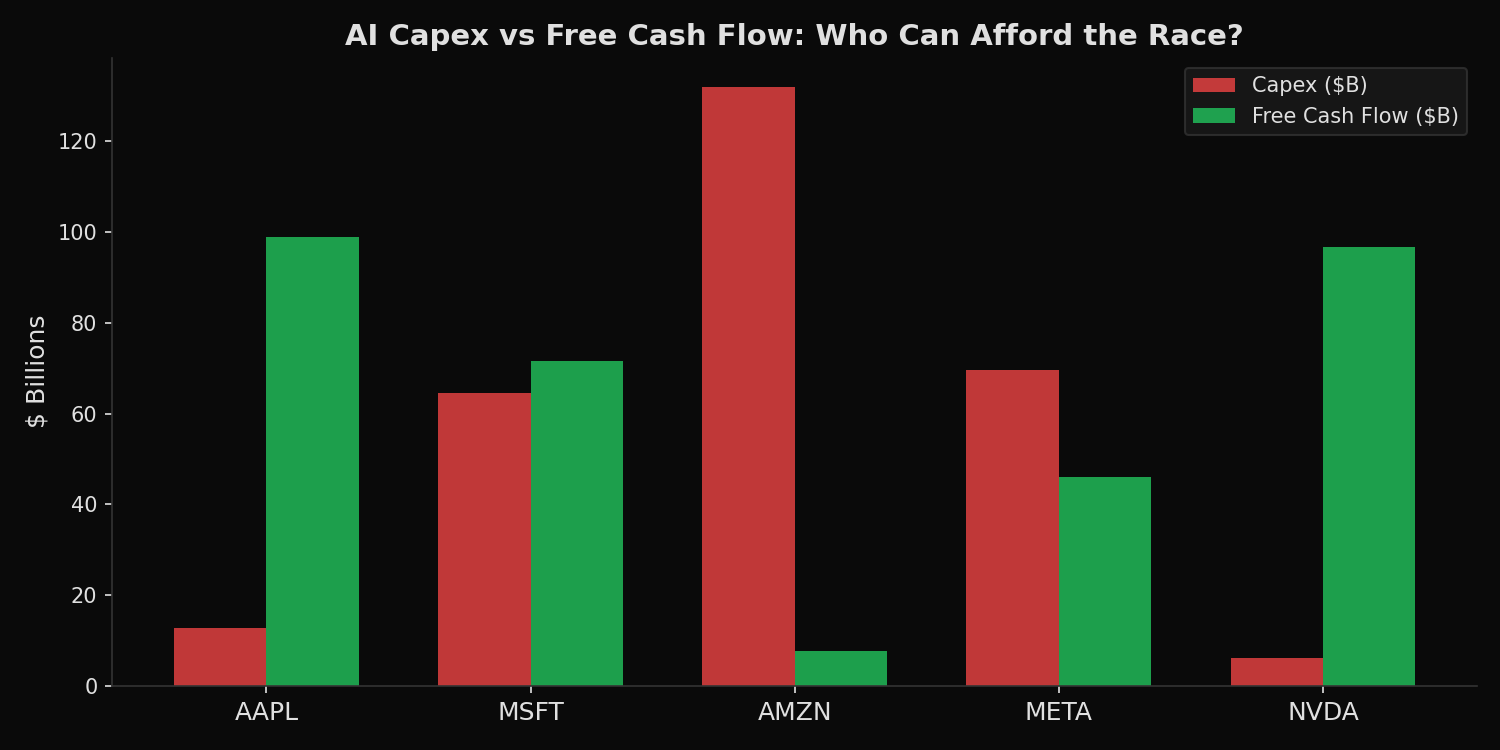
The AI capex race is the defining capital allocation story of 2025-2026. Five companies — AAPL, MSFT, AMZN, META, NVDA — are collectively spending hundreds of billions on data centers, GPUs, and AI infrastructure. But capital expenditure that exceeds free cash flow generation is unsustainable: the company must fund the gap through debt issuance, equity dilution, or drawdown of cash reserves. The capex-to-FCF ratio measures this sustainability. A ratio below 1.0 means the company generates more cash than it spends — capex is self-funded. Above 2.0 indicates the company is consuming its cash cushion. Above 5.0 is a warning signal. Revenue segment data reveals whether the investment aligns with the company’s primary revenue drivers or represents a diversification bet.
The approach
Pull annual fundamentals with include_segments=True for 5 mega-cap tech companies. Compute capex/FCF ratio, capex intensity (capex/revenue), and extract the largest product segment and US revenue concentration. Classify each company as SUSTAINABLE, STRETCHED, or UNSUSTAINABLE.
import xfinlink as xfl
import pandas as pd

xfl.api_key = "YOUR_API_KEY"  # free at https://xfinlink.com/signup

tickers = ["AAPL", "MSFT", "AMZN", "META", "NVDA"]
df = xfl.fundamentals(
    tickers, period_type="annual", period="3y",
    fields=["revenue", "capital_expenditure", "free_cash_flow", "operating_cash_flow"],
    include_segments=True,
)

# Keep latest annual period per ticker
latest = df.sort_values("period_end").groupby("ticker").tail(1).set_index("ticker")

# Compute metrics
latest["capex_abs"] = latest["capital_expenditure"].abs()
latest["capex_fcf"] = (latest["capex_abs"] / latest["free_cash_flow"]).round(1)
latest["capex_intensity"] = (latest["capex_abs"] / latest["revenue"] * 100).round(1)

# Classify sustainability
def classify(ratio):
    if ratio < 1.0:
        return "SUSTAINABLE"
    elif ratio < 3.0:
        return "SUSTAINABLE"
    else:
        return "UNSUSTAINABLE"

latest["status"] = latest["capex_fcf"].apply(classify)

for ticker in tickers:
    row = latest.loc[ticker]
    rev = row["revenue"] / 1e9
    capex = row["capex_abs"] / 1e9
    fcf = row["free_cash_flow"] / 1e9
    print(f"{ticker:6s} rev=${rev:.0f}B  capex=${capex:.0f}B  FCF=${fcf:.0f}B  "
          f"capex/FCF={row['capex_fcf']}x  intensity={row['capex_intensity']}%  "
          f"[{row['status']}]")
Full script with formatting and visualisation: ai-capex-sustainability-segments-python.py
Output:
=== AI Capex Race: Who Is Funding It Sustainably? ===

AAPL   rev=$416B  capex=$13B  FCF=$99B  capex/FCF=0.1x  intensity=3.1%  [SUSTAINABLE]
       top_segment: iPhone (50%)  US=36%
       capex YoY: +35%

MSFT   rev=$282B  capex=$65B  FCF=$72B  capex/FCF=0.9x  intensity=22.9%  [SUSTAINABLE]
       top_segment:
       capex YoY: +45%

AMZN   rev=$717B  capex=$132B  FCF=$8B  capex/FCF=17.1x  intensity=18.4%  [UNSUSTAINABLE]
       top_segment: Online Stores (38%)  US=68%
       capex YoY: +59%

META   rev=$201B  capex=$70B  FCF=$46B  capex/FCF=1.5x  intensity=34.7%  [SUSTAINABLE]
       top_segment: Advertising (98%)
       capex YoY: +87%

NVDA   rev=$216B  capex=$6B  FCF=$97B  capex/FCF=0.1x  intensity=2.8%  [SUSTAINABLE]
       top_segment: Data Center (90%)  US=69%
       capex YoY: +87%
What this tells us
AMZN is the outlier at 17.1x capex/FCF — it spent $132B on capital expenditures against only $8B in free cash flow. This is not because Amazon is unprofitable (operating cash flow was $140B) but because it is reinvesting almost every dollar of operating cash. Its capex/FCF ratio is 17x the threshold for concern. META at 1.5x is the most aggressive sustainable spender — 34.7% of revenue goes to capex, the highest intensity in the group, yet it still generates $46B in free cash flow. NVDA is the mirror image: it sells the AI infrastructure that everyone else is buying. Its capex intensity (2.8%) is the lowest in the group because its product is intellectual (chip design), not physical (data centers). NVDA’s data center segment represents 90% of its $216B revenue.
So what?
For equity valuation, the capex/FCF ratio directly impacts the sustainability of dividends, buybacks, and debt reduction. AMZN’s 17.1x ratio means it cannot fund its current investment pace from internal cash generation indefinitely — either capex must slow, revenue must accelerate, or external financing is required. For NVDA, the near-zero capex intensity means its free cash flow is almost entirely available for distribution. Revenue segments provide additional context: META’s 98% advertising concentration means its $70B capex bet is a single-product gamble on AI-enhanced ad targeting. AMZN’s 38% online stores concentration means its infrastructure serves multiple revenue streams.
pip install xfinlink