
What’s the question?
Market interest rates rose sharply from 2022 onwards, and the usual inference is that corporate borrowers now pay much more to service their debt.
The inference skips a step. Large companies borrow mostly at fixed coupons on bonds with maturities measured in years, and a bond issued in 2020 keeps paying its 2020 coupon until it matures. Higher market rates reach the income statement only when old debt matures and gets replaced, or when a company draws on a floating-rate facility. The pass-through is therefore slow and partial, spread over whatever the maturity schedule happens to look like.
The effective interest rate measures what actually arrived. Divide a year’s interest expense by the average debt balance carried through that year, and the result is the blended coupon the company genuinely paid, across every instrument it holds. It is backward-looking, and that is the point: it reports the cost that hit earnings, not the cost of a fresh dollar today.
The approach
The universe is the current S&P 500 outside Financials and Real Estate, since a bank’s interest expense is a cost of doing business rather than a cost of funding itself.
- Pull interest expense and total debt for every fiscal year from 2018 through 2025, deriving the fiscal year from the period end rather than the fiscal year label, so that a January year-end is credited to the year that just closed.
- For each company and year, divide interest expense by the average of the opening and closing debt balance.
- Require average debt above 500 million dollars and a resulting rate between 0.5 and 15 percent. Below that threshold the ratio is dominated by rounding; outside that band the figure is not describing a coupon.
- Track the median and the interquartile range across the whole panel, then measure the change per company between fiscal 2021, the trough, and fiscal 2025.
Code
import pandas as pd
import xfinlink as xfl

xfl.set_api_key("YOUR_API_KEY")  # free at https://xfinlink.com/signup

YEARS = [2019, 2020, 2021, 2022, 2023, 2024, 2025]

ids = xfl.index("sp500")["entity_id"].dropna().astype(int).tolist()
f = pd.concat([xfl.fundamentals(entity_id=ids[i:i + 100], period_type="annual",
                                start="2017-06-01",
                                fields=["interest_expense", "total_debt"])
               for i in range(0, len(ids), 100)], ignore_index=True)

f = f[~f["gics_sector"].isin(["Financials", "Real Estate"])]
pe = pd.to_datetime(f["period_end"])
f["fy"] = pe.dt.year - (pe.dt.month < 6).astype(int)

p = f.pivot_table(index="entity_id", columns="fy",
                  values=["interest_expense", "total_debt"], aggfunc="last")

rate = {}
for y in YEARS:
    avg_debt = (p["total_debt"][y] + p["total_debt"][y - 1]) / 2
    r = 100 * p["interest_expense"][y] / avg_debt
    rate[y] = r.where((avg_debt > 500) & (r > 0.5) & (r < 15))
rate = pd.DataFrame(rate)

print(rate.median().round(2))
both = rate[[2021, 2025]].dropna()
print((both[2025] - both[2021]).median())
Full script with formatting and visualisation: corporate-debt-repricing-effective-rate-python.py
Output
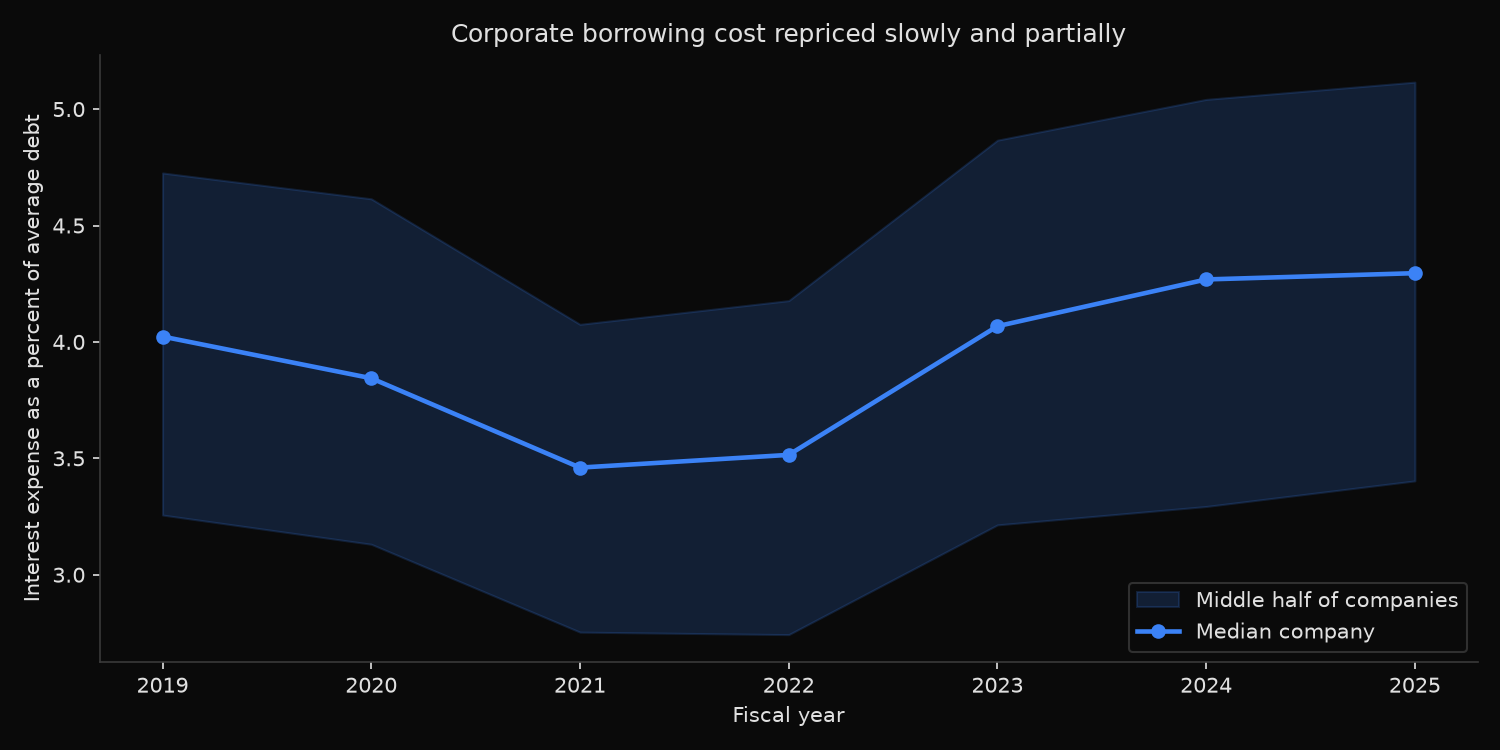
Effective interest rate on corporate debt, S&P 500 non-financials
fiscal year     n     25th   median     75th
2019          290     3.26     4.02     4.73
2020          298     3.13     3.84     4.61
2021          294     2.75     3.46     4.08
2022          305     2.74     3.51     4.18
2023          311     3.21     4.07     4.87
2024          304     3.29     4.27     5.04
2025          285     3.40     4.30     5.12

Companies with a usable rate in both FY2021 and FY2025: 251
Median FY2021 3.41%  ->  median FY2025 4.29%
Median change per company: +0.76 percentage points
Rate rose:  199 companies (79%)
Rose by more than 2 points: 32 companies
Fell:       52 companies

By sector (median):
                         n  fy2021  fy2025  change
Utilities               25    3.73    4.59    0.95
Consumer Discretionary  28    3.70    4.61    0.90
Consumer Staples        23    3.02    3.98    0.86
Industrials             41    3.24    4.21    0.80
Health Care             43    3.00    3.93    0.75
Information Technology  44    3.66    4.27    0.75
Materials               19    3.14    4.09    0.65
Communication Services  11    3.09    3.73    0.34
Energy                  17    3.61    4.93    0.26

Largest increases:
ticker            gics_sector  2021  2025  change
  BKNG Consumer Discretionary  3.19  9.96    6.77
   UAL            Industrials  0.61  7.01    6.41
   SWK            Industrials  3.29  9.46    6.17
   ADP            Industrials  2.39  7.77    5.38
   WDC Information Technology  3.62  8.64    5.02
     J            Industrials  3.18  8.13    4.95
  JBHT            Industrials  4.11  8.62    4.51
   ADM       Consumer Staples  2.80  7.25    4.44

Largest decreases:
ticker            gics_sector  2021  2025  change
   MAS            Industrials  9.66  3.43   -6.24
   KHC       Consumer Staples  8.33  4.92   -3.41
  LITE Information Technology  3.85  0.87   -2.98
  AKAM Information Technology  3.73  0.80   -2.92
  ECHO Communication Services  6.39  3.73   -2.65
   PPL              Utilities  7.19  4.66   -2.54
What this tells us
The repricing is real and small. The median effective rate across the panel bottomed at 3.46 percent in fiscal 2021 and reached 4.30 percent in fiscal 2025, and the per-company median change over that span is 0.76 percentage points. Four years after market rates began climbing, the typical large American company pays 0.28 points more on its debt than it did in 2019.
The distribution rules out a quiet catastrophe in the tail. 199 of 251 companies saw their rate rise, so the direction is close to universal, but only 32 rose by more than two points and 52 actually fell. The interquartile band in the chart widens on the way up, from 1.33 points in 2021 to 1.72 in 2025, which is what partial repricing looks like: companies whose maturities happened to fall in the window moved, and companies whose maturities did not stayed where they were.
Sector medians cluster in a narrow range, 0.26 points for Energy to 0.95 for Utilities. Nothing here suggests one sector was protected in a way the others missed. Utilities move furthest because they issue continuously to fund capital programmes, so a larger share of their stack turns over each year.
The extremes are a different phenomenon and should not be read as coupons. Booking Holdings at 9.96 percent and United Airlines moving from 0.61 to 7.01 are companies whose debt balance changed substantially inside the year, which makes the average of two year-end balances a poor description of what was outstanding when interest accrued. The same mechanism runs in reverse for Masco and Kraft Heinz. Read the extremes as balance sheet changes; read the median as repricing.
So what?
Stop modelling corporate interest burden off current market yields. A screen that shocks every borrower to today’s new-issue rate overstates the earnings pressure by roughly the gap between 4.30 and whatever the current yield on comparable paper is, and it does so for every company that is not refinancing this year.
The risk is a maturity question rather than a rate question. A company with an effective rate near 3 percent and a wall of maturities inside two years faces a repricing that has not happened yet; a company at 4.5 percent with a long-dated stack has already absorbed most of what is coming. Pair the effective rate with the maturity schedule, and the difference between the two is a usable measure of how much repricing remains. Debt sized against operating earnings, rather than by its coupon, is the basis of a net debt to EBITDA screen.
Compute the rate per company rather than borrowing a sector average for a stress test. The interquartile band spans 1.72 points while the sector medians span less than one, so the variation that matters sits inside sectors, not between them.
Built with xfinlink — free financial data API for Python.