
How Much of a Ticker History Belongs to Another Company? Entity Resolution in Python
September 17, 2026
What’s the question?
A ticker symbol is leased, not owned. Once the company holding it is acquired or wound up, the exchange can hand those letters to somebody else, and the new holder inherits a symbol with a past. An archive keyed on the symbol keeps filing rows under the same three or four letters throughout, so two companies end up in one series, sorted by date, with no separator between them.
Nobody would knowingly measure General Motors by including the prices of a predecessor that went through Chapter 11. The question is how often this happens by accident on the index as it stands today, and what it does to the numbers that come out.
Annualised volatility, the standard deviation of daily returns scaled to a year, and maximum drawdown, the worst peak-to-trough loss a series records, both read every session in the window. One fabricated session enters both.
The approach
The universe is the current S&P 500 roster, 504 symbols. The assignment history of each symbol names every company that has held those letters and the dates each assignment was valid, enough to attribute a price row to whoever held the symbol on the day it was quoted.
- Pull the roster, then resolve every symbol to its holders.
- Keep symbols where the sitting index member holds the letters now and an earlier holder gave them up beforehand, that earlier tenure ending inside the modern price record.
- Attribute each daily row to the holder on that date, identifying each holder by its symbol tenure rather than by name. The symbol-keyed series is every row under the letters; the resolved series is only the current member’s rows.
- Require 250 sessions and 90% session coverage from each holder, and exclude any symbol carrying a single session above 100% inside one tenure as a suspected corporate-action artefact.
- Compute annualised volatility and maximum drawdown for both series, plus the return implied by the join between one holder’s last row and the next holder’s first.
Returns come from split-adjusted closing prices, so every figure below is a price return.
Code
import numpy as np
import pandas as pd
import xfinlink as xfl

xfl.set_api_key("YOUR_API_KEY")  # free at https://xfinlink.com/signup

roster = xfl.index("sp500")
holder = {t: int(e) for t, e in zip(roster["ticker"], roster["entity_id"])}
history = {}
for i in range(0, len(holder), 10):                       # resolve takes ten symbols
    history.update(xfl.resolve(sorted(holder)[i:i + 10])["data"])

cases = []
for sym, block in history.items():
    ents = block.get("entities", [])
    now = [e for e in ents if e["ticker_valid_to"] is None and e["entity_id"] == holder.get(sym)]
    prior = [e for e in ents if now and e["entity_id"] != now[0]["entity_id"]
             and e["ticker_valid_to"]
             and "1996-01-01" <= e["ticker_valid_to"] < now[0]["ticker_valid_from"]]
    if len(now) == 1 and prior:
        cases.append({"sym": sym, "now": now[0], "prior": prior})

ids = sorted({c["now"]["entity_id"] for c in cases}
             | {p["entity_id"] for c in cases for p in c["prior"]})
px = pd.concat([xfl.prices(entity_id=i, start="1990-01-01",
                           fields=["close", "adj_close"], max_rows=40000) for i in ids])
px["date"] = pd.to_datetime(px["date"])

def tenure(sym, ent):                       # rows filed under sym while ent held it
    end = pd.Timestamp(ent["ticker_valid_to"] or "2100-01-01")
    rows = px[(px["entity_id"] == ent["entity_id"]) & (px["ticker"] == sym)
              & (px["date"] >= pd.Timestamp(ent["ticker_valid_from"])) & (px["date"] <= end)]
    return rows.sort_values("date")

def risk(level):
    r = level.pct_change().dropna()
    growth = (1 + r).cumprod()
    return r.std() * np.sqrt(252), (growth / growth.cummax() - 1).min(), r.abs().max()

def covered(rows):                          # sessions present over the span they cover
    span = np.busday_count(rows["date"].min().date(), rows["date"].max().date()) + 1
    return len(rows) / span

for case in cases:
    old = [t for t in (tenure(case["sym"], e) for e in case["prior"]) if len(t)]
    new = tenure(case["sym"], case["now"])
    if not old or len(new) < 250 or sum(len(o) for o in old) < 250:
        continue
    if min(covered(o) for o in old + [new]) < 0.90:
        continue
    if max(o.set_index("date")["adj_close"].pct_change().abs().max() for o in old + [new]) > 1.0:
        continue
    spliced = pd.concat(old + [new]).sort_values("date")
    join = new["adj_close"].iloc[0] / spliced["adj_close"].iloc[len(spliced) - len(new) - 1] - 1
    vol_s, dd_s, biggest = risk(spliced.set_index("date")["adj_close"])
    vol_r, dd_r, _ = risk(new.set_index("date")["adj_close"])
    earlier = case["prior"][-1]                            # named by tenure, not by name
    print(case["sym"], earlier["ticker_valid_from"], earlier["ticker_valid_to"],
          round(join * 100), round(vol_s * 100, 1), round(vol_r * 100, 1),
          round(dd_s * 100, 1), round(dd_r * 100, 1), np.isclose(biggest, abs(join)))
Full script with formatting and visualisation: recycled-ticker-price-history-risk-python.py
Output
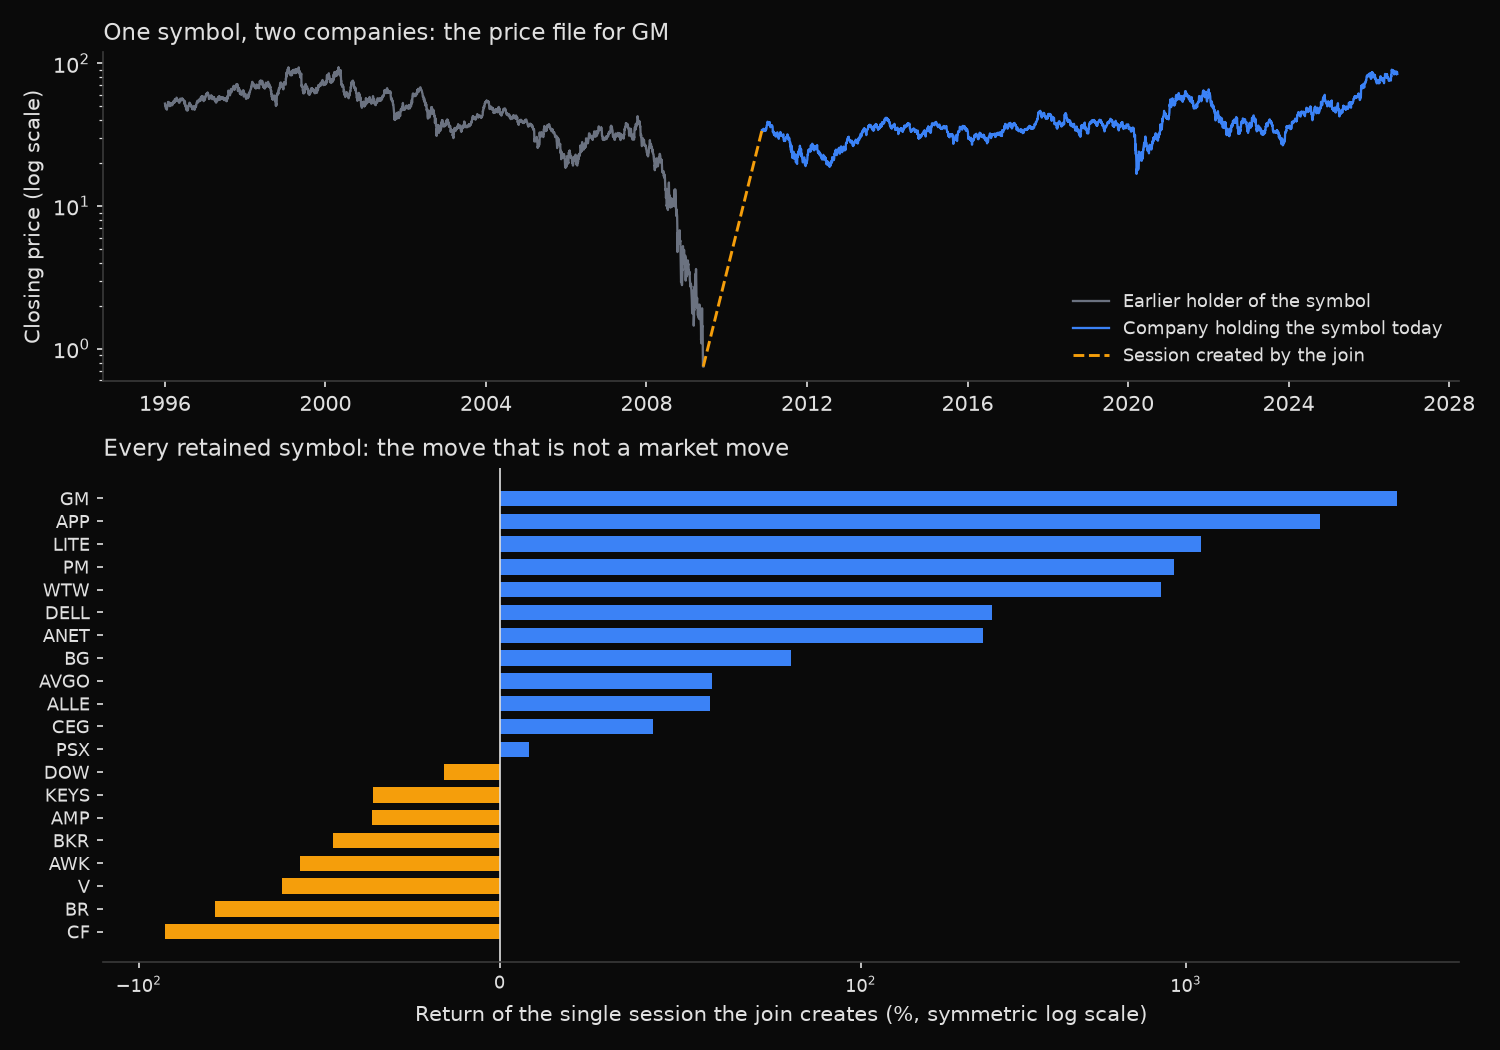
Current S&P 500 members whose symbol had an earlier holder quoted in the modern record
symbols examined: 504   with an earlier holder: 33   retained: 20
dropped: under 250 sessions on one side 10   below 90% session coverage 2 ['FI', 'SMCI']   single-session artefact 1 ['VST']
returns from split-adjusted closes   price record opens 1996-01-02   latest session 2026-09-16

sym   earlier holder held the symbol    series from  foreign    gap      join             vol      max drawdown
---------------------------------------------------------------------------------------------------------------
GM    1962-07-02 to 2009-06-01           1996-01-02    45.9%     1y     4459%   826.6%    34.4%    -99.2%    -63.9%
APP   1994-02-10 to 1998-03-20           1996-01-02    29.2%    23y     2575%   935.3%    77.1%    -91.9%    -91.9%
LITE  1997-10-16 to 2003-09-19           1997-10-16    34.8%    12y     1109%   283.0%    56.9%    -94.7%    -66.9%
PM    1995-03-30 to 1999-01-10           1996-01-02    14.1%     9y      918%   200.6%    23.8%    -62.5%    -51.2%
WTW   1997-11-13 to 1999-09-02           1997-11-13    27.9%    22y      838%   331.7%    24.2%    -63.5%    -30.8%
DELL  1988-06-22 to 2013-10-29           1996-01-02    69.8%     5y      253%    69.0%    52.7%    -86.3%    -70.5%
ANET  1995-05-03 to 2000-08-10           1996-01-02    27.4%    14y      237%    83.2%    45.7%    -89.6%    -52.2%
CF    1999-12-06 to 2004-08-31           1999-12-06    18.3%     1y      -93%    46.5%    44.6%    -94.9%    -76.8%
BG    1977-04-04 to 1999-05-27           1996-01-02    12.0%     2y       81%    37.1%    33.5%    -77.5%    -77.5%
BR    1988-07-08 to 2006-03-31           1996-01-02    34.5%     1y      -79%    32.0%    26.4%    -89.6%    -59.4%
V     1989-09-08 to 1997-06-12           1996-01-02     7.3%    11y      -60%    32.2%    28.3%    -70.3%    -52.1%
AVGO  2000-09-27 to 2003-02-25           2000-09-27    12.3%     6y       59%    62.9%    38.2%    -98.6%    -48.8%
ALLE  1995-10-03 to 2004-04-08           1996-01-02    39.3%    10y       58%    38.2%    26.0%    -63.2%    -43.4%
AWK   1962-07-02 to 2003-01-09           1996-01-02    27.6%     5y      -55%    26.1%    23.2%    -64.1%    -39.7%
BKR   1975-05-01 to 2013-10-11           1996-01-02    72.0%     6y      -46%    44.9%    42.0%    -82.3%    -63.6%
CEG   1999-05-03 to 2012-03-12           1999-05-03    73.6%    10y       42%    39.0%    48.7%    -85.5%    -50.8%
AMP   1962-07-02 to 1999-04-01           1996-01-02    13.5%     7y      -36%    40.3%    39.5%    -81.5%    -81.5%
KEYS  1996-06-21 to 2007-10-12           1996-06-21    48.8%     7y      -35%    39.5%    32.2%    -83.3%    -45.5%
DOW   1954-04-20 to 2017-08-31           1996-01-02    74.4%     2y      -16%    35.2%    38.6%    -88.8%    -70.9%
PSX   1978-05-11 to 1998-03-31           1996-01-02    13.6%    14y        8%    36.1%    33.5%    -65.9%    -65.9%
---------------------------------------------------------------------------------------------------------------
                                                       28.5%              70%    42.6%    36.3%    -84.4%    -61.5%   median

join exceeds a 20% single-session move: 18 of 20
join is the largest single session in the spliced series: 16 of 20
volatility overstated by the splice: 18 of 20   median ratio 1.22x
maximum drawdown deepened by the splice: 16 of 20
What this tells us
Twenty of 504 index members sit on a second-hand symbol whose previous holder was quoted inside the modern price record. Four percent of the roster, and not the small end of it: Visa, Broadcom, Philip Morris International, General Motors, Dell, Arista Networks. A median of 28.5% of the rows filed under those symbols belong to the earlier holder, above 70% for DOW, CEG and BKR.
The join between the two tenures produces a session above 20% in 18 of the 20, and in 16 it is the largest single session anywhere in the spliced series. When the biggest move in a company’s recorded history is a bookkeeping event, any statistic ranked on extremes finds it first.
General Motors gives the cleanest reading. The predecessor closed at 0.75 on 1 June 2009, the day it filed for bankruptcy protection, and the current company first closed at 34.19 on 18 November 2010. Read as consecutive rows, those closes imply a return of 4,459%, and annualised volatility for the symbol reads 826.6% against 34.4% for the company. The direction is not always upward: CF reads -93%, because Charter One Financial was bought at 44.47 and CF Industries listed a year later at 3.24.
The median distortion is milder than the tail suggests. Volatility rises by a factor of 1.22 at the median, the kind of error that passes review because the number still looks like a plausible equity volatility. Maximum drawdown deepens from -61.5% to -84.4%. Broadcom is the sharpest case, -48.8% on the resolved series against -98.6% on the symbol, because AvantGo’s collapse in the dot-com unwind becomes part of Broadcom’s record.
Some handovers follow corporate lineage, such as Dow Chemical to Dow Inc; others connect businesses with nothing in common, such as American Paging to AppLovin. The arithmetic does not tell them apart.
So what?
Key long price histories on the company, not on the symbol. A permanent entity identifier survives renames, relistings and reassignments, so a request made against it returns one company’s prices and stops where that company’s listing stops.
Two cheap checks catch most of the problem. Compare the first date of every series against the date the company listed, since a row that pre-dates the IPO belongs to somebody else. Then rank the single-session returns and read the top of the list; a move of several hundred percent on a date with no corresponding news is a join, not a market.
Risk models, volatility targets and factor regressions run on long windows, exactly the range over which a symbol is most likely to have changed hands. Twenty large index members carrying a median of 28% foreign history is enough to move a portfolio-level risk estimate, and none of it announces itself in a row count or an error message.
Built with xfinlink — free financial data API for Python. pip install -U xfinlink
pip install -U xfinlink