
Is AI Revenue Circular? Customer-Vendor Capex Loop Analysis in Python
May 31, 2026
What's the question?
The circularity concern in AI is simple: one group of companies spends heavily on AI infrastructure, and another group reports revenue growth by selling the chips, networking equipment, and related infrastructure needed for that buildout. If the spending is funded by durable cash generation, the loop can be economically sound. If the spending depends on increasingly aggressive financing or customer commitments that pull future demand into the present, the same loop can become fragile.
Public equity data cannot prove whether a specific private contract is circular. It can test the visible footprint. The relevant question is whether buyer capital expenditure is rising at the same time supplier revenue and gross profit are accelerating. Capital expenditure is cash spent on long-lived assets such as data centers and servers. Gross profit is revenue minus direct cost of goods sold. Together, they show whether the buyers are absorbing capital intensity while suppliers are monetizing it.
The approach
The test separates the AI infrastructure chain into buyers and suppliers. MSFT, AMZN, META, GOOG, and ORCL are treated as infrastructure buyers. NVDA and AVGO are treated as suppliers.
- Pull annual fundamentals for the last five annual observations per company
- Aggregate buyer capital expenditure, buyer free cash flow, supplier revenue, and supplier gross profit
- Compare the latest annual observation with the observation four years earlier
- Screen each buyer for capex intensity, capex-to-free-cash-flow pressure, and year-over-year capex growth
This is not a forensic contract analysis. It is a public-market stress test of whether the operating data shows a reinforcing capital-spending loop.
Code
import xfinlink as xfl
import pandas as pd
import numpy as np

xfl.set_api_key("YOUR_API_KEY")  # free at https://xfinlink.com/signup

buyers = ["MSFT", "AMZN", "META", "GOOG", "ORCL"]
suppliers = ["NVDA", "AVGO"]
tickers = buyers + suppliers

df = xfl.fundamentals(
    tickers,
    period_type="annual",
    period="8y",
    fields=["revenue", "capital_expenditures", "free_cash_flow",
            "operating_cash_flow", "gross_profit"],
)

recent = df.sort_values(["ticker", "period_end"]).groupby("ticker").tail(5)
recent["observation"] = recent.groupby("ticker").cumcount() - 4
recent["capex_abs"] = recent["capital_expenditures"].abs()

buyer_recent = recent[recent["ticker"].isin(buyers)]
supplier_recent = recent[recent["ticker"].isin(suppliers)]

trend = pd.DataFrame({
    "buyer_capex": buyer_recent.groupby("observation")["capex_abs"].sum(),
    "buyer_fcf": buyer_recent.groupby("observation")["free_cash_flow"].sum(),
    "supplier_revenue": supplier_recent.groupby("observation")["revenue"].sum(),
    "supplier_gross_profit": supplier_recent.groupby("observation")["gross_profit"].sum(),
})

print(trend.loc[0] / 1000)
Full script with formatting and visualisation: ai-customer-vendor-capex-loop-python.py
Output
=== AI Customer-Vendor Capex Loop ===
Five annual observations ending at each company's latest fiscal year
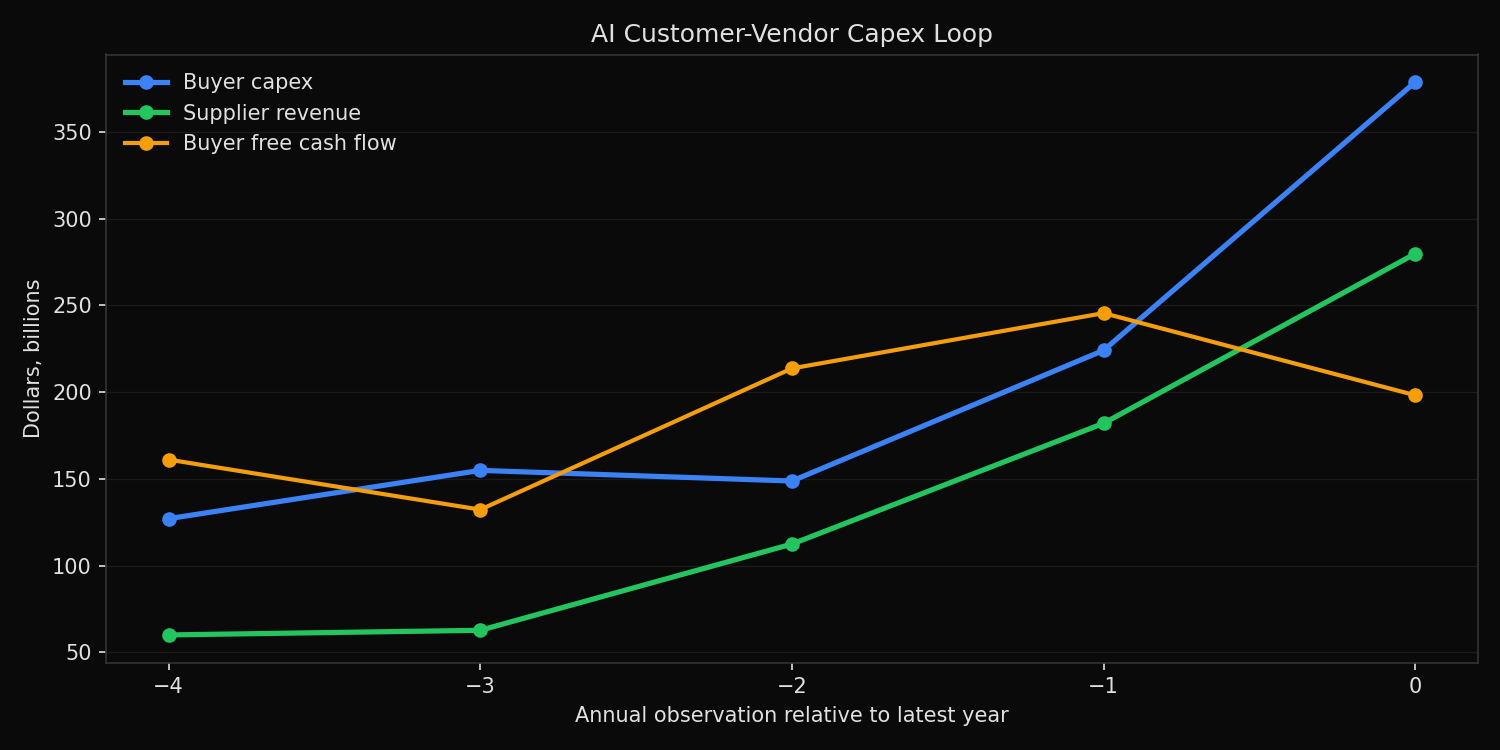
Buyer capex: $378.7B (+198% vs t-4)
Buyer free cash flow: $198.3B
Supplier revenue: $279.8B (+365% vs t-4)
Supplier gross profit: $196.8B
Supplier revenue / buyer capex: 0.74x
Buyer capex pressure:
MSFT capex=$ 64.6B capex/revenue=22.9% capex/FCF= 0.9x YoY= +45%
AMZN capex=$ 131.8B capex/revenue=18.4% capex/FCF= 17.1x YoY= +59%
META capex=$ 69.7B capex/revenue=34.7% capex/FCF= 1.5x YoY= +87%
GOOG capex=$ 91.4B capex/revenue=22.7% capex/FCF= 1.2x YoY= +74%
ORCL capex=$ 21.2B capex/revenue=37.0% capex/FCF=FCF<0 YoY= +209%
Supplier monetization:
NVDA revenue=$ 215.9B YoY revenue= +65% gross margin=71.1% FCF margin=44.8%
AVGO revenue=$ 63.9B YoY revenue= +24% gross margin=67.8% FCF margin=42.1%What this tells us
The public numbers show a strong operating loop. Buyer capex reached $378.7B in the latest annual observation, up 198% from four observations earlier. Supplier revenue reached $279.8B, up 365% over the same observation window. Supplier gross profit is also large at $196.8B, which means the suppliers are not simply passing through hardware cost. They are earning high-margin revenue from the buildout.
The pressure is not evenly distributed. AMZN is the largest absolute spender at $131.8B and has capex equal to 17.1 times free cash flow. ORCL is more stressed on a cash basis because free cash flow is negative while capex reached $21.2B. META and GOOG show very high capex intensity, but both still produce positive free cash flow. MSFT is the most internally funded buyer in this group, with capex at 0.9 times free cash flow.
The supplier side is much cleaner. NVDA and AVGO both show gross margins above 67% and free cash flow margins above 42%. The visible profit pool is therefore concentrated on the supplier side, while the visible capital burden is concentrated on the buyer side.
So what?
This evidence supports a narrow version of the circularity concern: AI infrastructure spending has become a reinforcing loop between customer capex and supplier revenue. It does not prove that the revenue is artificial, or that contracts are economically invalid. It does show that the investment thesis depends on buyers eventually converting heavy infrastructure spending into durable revenue and cash flow.
For investors, the practical test is funding quality. Supplier margins can remain exceptional even while buyer economics deteriorate. A robust AI portfolio should therefore separate suppliers with high free cash flow conversion from buyers whose capex is outrunning cash generation. The loop is investable only if the buyer side can earn an adequate return on the assets being built.
Built with xfinlink — free financial data API for Python. pip install xfinlink
pip install xfinlink