BLOG

Behind the numbers.

Code examples, market analysis, and data quality deep-dives.

Are Consumer Staples Margins Shrinking Under Inflation? Gross Margin Trend Analysis in Python
Do Weak Jobs Reports Predict Market Drawdowns? NFP Surprise Event Study in Python
Is the Rotation From Tech to Industrials Backed by Earnings? Relative EPS Growth Analysis in Python
Is the Semiconductor Rally Broadening Beyond NVIDIA? Return Dispersion Analysis in Python
Which Stocks Benefit Most When Oil Prices Fall? Oil Beta Screening in Python
Do Bond Returns Predict Stock Returns? Granger Causality Test in Python
Which Stocks Actually Drive Portfolio Returns? Shapley Value Attribution in Python
Does "Sell in May" Still Work? Calendar Anomaly Backtest in Python
How to Build Complete Price History Through Ticker Changes? Entity Resolution in Python
Are KO and PEP Cointegrated? Pairs Trading Signal Construction in Python
Which Commodities Have the Strongest Momentum? Rotation Backtest in Python
Which Commodity ETFs Have the Worst Tail Risk? Expected Shortfall in Python
Are Gold Miners Leveraged Gold Bets? Rolling Beta Analysis in Python
Does the Base-Metals-to-Gold Ratio Lead Cyclical Stocks? Signal Test in Python
Can Risk Parity Tame Commodity Volatility? Portfolio Optimization in Python
Are Power Stocks Becoming an AI Infrastructure Trade? Momentum Screening in Python
Which AI Chip Stocks Have Margin Momentum? Profitability Trend Analysis in Python
Which AI Stocks Are Cheapest Relative to Growth? Growth-Adjusted Valuation in Python
Does AI Stock Leadership Persist? Momentum Backtest in Python
Which AI Stocks Have the Cleanest Balance Sheets? Net Cash Screening in Python
Can Risk Parity Reduce Mega-Cap Drawdowns? Portfolio Optimization in Python
Which Growth Stocks Are Self-Funding? Cash-Flow Quality Screening in Python
Which Sectors Struggle When the Dollar Rallies? Sector Rotation Analysis in Python
Do Cheap Stocks Hold Up When Bonds Sell Off? Valuation Rotation in Python
Does the Nasdaq 100 Have Better Growth Quality Than the Dow? Index Constituent Analysis in Python
Do Healthcare Cash-Flow Margins Predict Returns? Signal Evaluation in Python
Which Dividend Stocks Survive a Cash-Flow Stress Test? Dividend Screening in Python
Does Heavy Insider Selling Predict Weak Returns? Insider Flow Test in Python
Can Quality Screens Reduce Small-Cap Balance-Sheet Risk? Russell 2000 Test in Python
Which Retailers Have Positive Operating Leverage? Margin Screening in Python
Is MSTR a Leveraged Bitcoin Proxy? Rolling Beta Analysis in Python
Is Micron's Memory Cycle Recovering? Inventory and Margin Forecasting in Python
Which Sectors Work When Bonds Rally? Rate-Sensitive Rotation in Python
Do One-Month Price Extremes Reverse? Signal Evaluation in Python
Do Low-Volatility S&P 500 Stocks Reduce Drawdowns? Factor Test in Python
Is AI Capex Paying Back Fast Enough? Revenue Hurdle Forecasting in Python
Could Shorter AI Asset Lives Hit Earnings? Depreciation Stress Test in Python
How Much AI Capex Risk Can a Portfolio Remove? Constrained Optimization in Python
Is the AI Capex Trade Crowded? Rolling Volatility and Sector Rotation in Python
Did the AI Boom Come From Existing S&P 500 Members? Point-in-Time Momentum Test in Python
Is AI Revenue Circular? Customer-Vendor Capex Loop Analysis in Python
Is the AI Trade Connected to Private Credit? Rolling Correlation Network in Python
Is Apollo More Balance-Sheet Sensitive Than Peers? Leverage Screen in Python
Are AI Earnings Supported by Cash Flow? Accrual and Capex Screen in Python
Can Defensive Stocks Hedge AI Drawdowns? Basket Regime Test in Python
How Fast Does the Market Price In Fed Decisions? FOMC Event Study in Python
How Much Are Options Sellers Overpaid? The Variance Risk Premium in Python
Which Companies Have the Worst Earnings Quality? Sloan Accrual Screen with Geographic Revenue Data in Python
Does the Oil-to-Gold Ratio Signal Recessions? XLE/GLD Backtest in Python
Is AI Spending Crowding Out Free Cash Flow? Capex Sustainability Across the Mag 7 in Python
Does a Long Energy / Short Bonds Portfolio Capture Inflation Surprises? Factor Construction in Python
Can a Hidden Markov Model Detect Oil Market Regimes? HMM Analysis in Python
Do Grain Prices Predict Food Inflation? Granger Causality Test in Python
Does the Corporate Credit Spread Predict Stock Market Crashes? BAA-AAA Spread Analysis in Python
Do Oil Stocks Hedge Inflation? Rolling Beta Analysis in Python
Which Stocks Are Most Rate-Sensitive? Equity Duration via Bond Beta in Python
Which Companies Have the Highest Accrual Ratios? Earnings Quality Screening in Python
Is Alpha Persistent or Decaying? Rolling Sharpe Ratio Analysis in Python
Are Markets Trending or Mean-Reverting? Hurst Exponent Analysis in Python
Is Consumer Discretionary vs Staples a Leading Indicator? XLY/XLP Ratio Analysis in Python
Does Heavy Capex Predict Future Stock Returns? Capital Expenditure Analysis in Python
How to Estimate Cost of Equity Using CAPM in Python
Is Volatility Predictable? Testing for Volatility Clustering in Python
Which Industrials Are Overleveraged? Net Debt to EBITDA Screening in Python
GM Before and After Bankruptcy: Why Entity Resolution Matters for Financial Data
What Is Adjusted Beta? Merrill Lynch Beta Shrinkage in Python
How Good Is a Stock Pick? Information Ratio and Tracking Error in Python
Do Stock Returns Follow a Normal Distribution? Testing for Fat Tails in Python
Which Large Caps Have the Highest Free Cash Flow Yield? FCF Screening in Python
Which Sectors Won Over 5 Years? Sector Rotation Analysis in Python
How to Forecast Stock Volatility with GARCH Models in Python
Are Stock Prices Mean-Reverting? Augmented Dickey-Fuller Test in Python
How to Calculate CAPM Alpha and Beta with Regression in Python
How to Compare Sector Sharpe Ratios and Sortino Ratios in Python
DELL: Why Stitching Historical Price Data Together Is Wrong
How to Analyze Drawdown and Recovery for Bank Stocks in Python
How to Screen SaaS Stocks by Revenue Growth and Cash Flow in Python
How to Screen REITs by Dividend Yield and Valuation in Python
How Correlated Are the Magnificent 7? Intra-Group Correlation in Python
AAPL vs XOM: Do Individual Stocks Have Seasonal Patterns?
How to Rank Large-Cap Stocks by Momentum in Python
How to Build a Multi-Endpoint Financial Dashboard in Python
How to Compare Volatility Across Energy Stocks in Python
How to Screen Healthcare Stocks by Valuation in Python
How to Build a Sector Correlation Matrix for Portfolio Diversification in Python
How to Find Oversold and Overbought Stocks Using Z-Scores in Python
How to Measure Earnings Quality: Cash Flow vs Net Income in Python
How to Build a Multi-Factor Stock Screen in Python (Value + Momentum + Quality)
How to Build a Simple DCF Model for Any Stock in Python
How to Screen Tech Stocks by Revenue Growth in Python
How to Screen Stocks by Balance Sheet Health in Python
Is "Sell in May" Real? SPY Monthly Seasonality Over 10 Years
How to Compare Sector Performance YTD Using Python
How to Track S&P 500 Additions and Removals Over Time in Python
How to Screen Dividend Stocks by Yield and Quality in Python
How to Calculate Max Drawdown and Recovery Time for Any Stock in Python
How to Compare Profitability Across Mega-Cap Tech Stocks in Python
Why Ticker Symbols Are Unreliable: The Recycling Problem Every Quant Should Know
How to Calculate and Compare Stock Volatility in Python
How to Screen Blue-Chip Stocks by P/E Ratio in Python
How to Track Companies Through Ticker Changes, Bankruptcies, and Renames in Python
S&P 500 Turnover: How Much the Index Has Changed Since 2010
How to Calculate Stock Beta and Correlation in Python
← All articles

Do Weak Jobs Reports Predict Market Drawdowns? NFP Surprise Event Study in Python

What's the question?

Non-Farm Payrolls (NFP) is the headline number from the US Bureau of Labor Statistics' monthly Employment Situation report. It counts the net change in paid employees across the US economy, excluding farm workers, government employees, private household workers, and nonprofit staff. The report is released on the first Friday of each month and is one of the most closely watched economic indicators in financial markets.

When the NFP number comes in well below expectations, the interpretation is that the labor market is weakening. A weakening labor market reduces consumer spending, lowers corporate revenue expectations, and raises the probability of recession. In June 2026, the US economy added only 57,000 jobs, well below consensus expectations. Unemployment fell to 4.2%, but only because 720,000 people left the labor force entirely. The natural question is whether historically weak NFP prints predict negative forward equity returns.

The alternative hypothesis is that weak NFP reports trigger a "Fed put" response: investors anticipate that the Federal Reserve will ease monetary policy to support the economy, and equity prices rise on rate cut expectations. Under this view, bad economic news is good news for stocks.

This analysis tests which interpretation the data supports. It examines 7 historically weak NFP releases between 2016 and 2026 and measures SPY forward returns over 5-day, 10-day, and 21-day horizons.

The approach

  1. Pull 11 years of daily closing prices for SPY to cover all NFP miss events
  2. Define 8 historically weak NFP report dates where the payroll number came in significantly below consensus expectations: May 2016 (38K), February 2019 (20K revision), September 2019 (130K), December 2020 (-140K), September 2021 (194K vs 750K expected), July 2024 (114K), October 2024 (12K, hurricane-impacted), and July 2026 (57K)
  3. For each date, compute the forward 5-day, 10-day, and 21-day return on SPY from the close on the report date
  4. Compare the average post-miss forward returns to the unconditional average forward returns over the full sample
  5. Run a one-sample t-test to determine whether the difference is statistically significant

The unconditional average serves as the benchmark. If weak NFP reports carry no information, post-miss returns should look similar to the full-sample average. If they carry predictive content, the means will diverge and the t-statistic will indicate significance.

Code

import xfinlink as xfl
import pandas as pd
import numpy as np
from scipy import stats

xfl.set_api_key("YOUR_API_KEY")  # free at https://xfinlink.com/signup

df = xfl.prices("SPY", period="11y", fields=["close"])
df = df.sort_values("date").reset_index(drop=True)

nfp_miss_dates = pd.to_datetime([
    "2016-05-06", "2019-02-01", "2019-09-06", "2020-12-04",
    "2021-09-03", "2024-07-05", "2024-10-04", "2026-07-03",
])

windows = [5, 10, 21]
results = []
for nfp_date in nfp_miss_dates:
    mask = df["date"] >= nfp_date
    if not mask.any():
        continue
    td = df.loc[mask, "date"].iloc[0]
    idx = df[df["date"] == td].index[0]
    row = {"nfp_date": nfp_date, "trade_date": td}
    for w in windows:
        if idx + w < len(df):
            row[f"fwd_{w}d"] = df.loc[idx + w, "close"] / df.loc[idx, "close"] - 1
        else:
            row[f"fwd_{w}d"] = np.nan
    results.append(row)

event_df = pd.DataFrame(results)

uncond = {}
for w in windows:
    uncond[f"fwd_{w}d"] = (df["close"].shift(-w) / df["close"] - 1).dropna().mean()

for _, r in event_df.iterrows():
    f5 = f"{r['fwd_5d']:.2%}" if pd.notna(r['fwd_5d']) else "N/A"
    f10 = f"{r['fwd_10d']:.2%}" if pd.notna(r['fwd_10d']) else "N/A"
    f21 = f"{r['fwd_21d']:.2%}" if pd.notna(r['fwd_21d']) else "N/A"
    print(f"{r['nfp_date'].strftime('%Y-%m-%d')}  {f5:>8} {f10:>8} {f21:>8}")

for w in windows:
    sample = event_df[f"fwd_{w}d"].dropna()
    t_stat, p_val = stats.ttest_1samp(sample, uncond[f"fwd_{w}d"])
    print(f"  {w}-day: t={t_stat:+.3f}, p={p_val:.4f}  n={len(sample)}")

Full script with formatting and visualisation: weak-nfp-market-drawdown-signal-python.py

Output
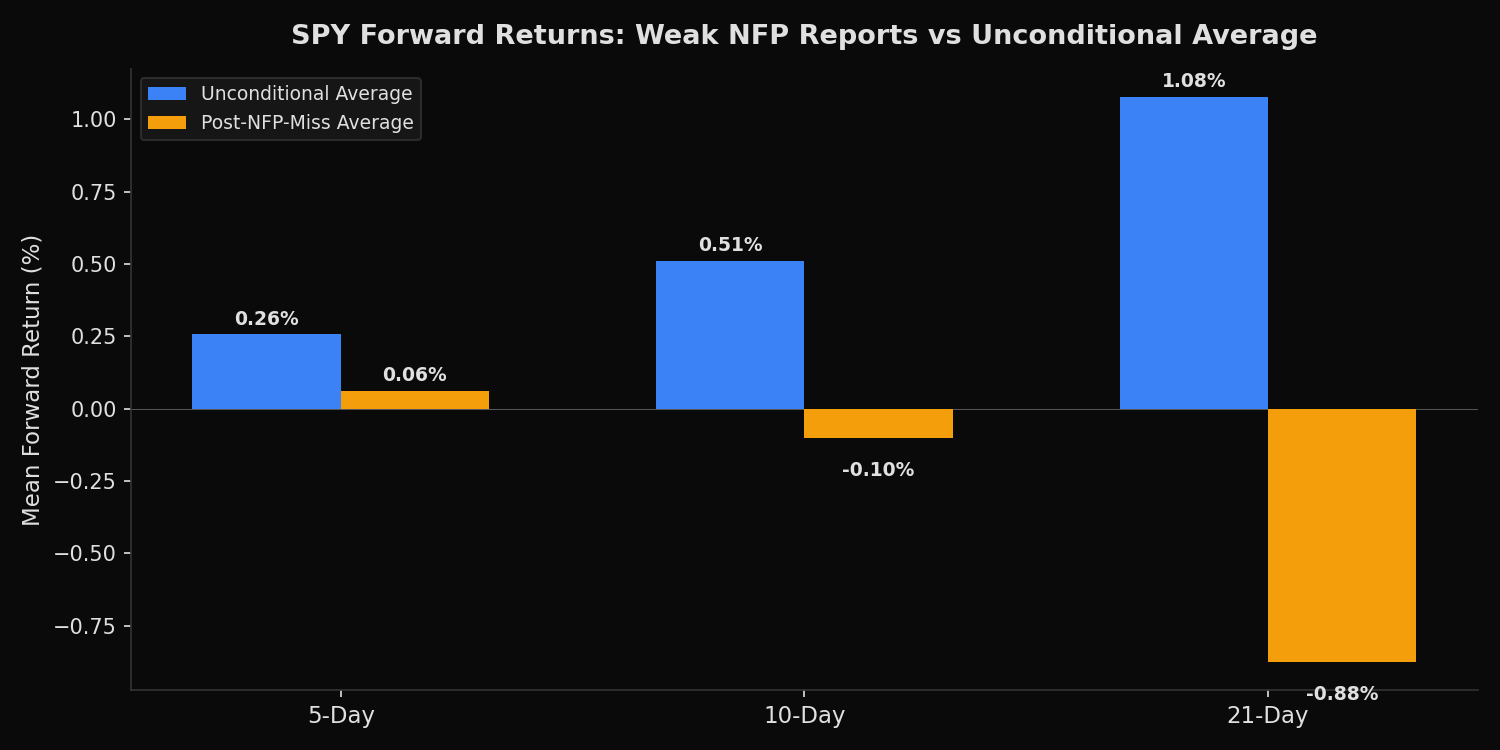
Grouped bar chart comparing SPY mean forward returns after weak NFP reports versus unconditional averages across 5-day, 10-day, and 21-day horizons
FORWARD SPY RETURNS AFTER WEAK NFP REPORTS

NFP Date       Trade Date          5-Day     10-Day     21-Day
--------------------------------------------------------------
2016-05-06     2016-05-06         -0.47%     -0.11%      2.90%
2019-02-01     2019-02-01          0.15%      2.71%      3.32%
2019-09-06     2019-09-06          1.02%      0.08%     -1.67%
2020-12-04     2020-12-04         -0.96%     -0.18%      1.00%
2021-09-03     2021-09-03         -1.43%     -4.20%     -4.41%
2024-07-05     2024-07-05          0.96%     -1.02%     -6.72%
2024-10-04     2024-10-04          1.15%      2.03%     -0.55%
2026-07-03     2026-07-06            N/A        N/A        N/A

Post-NFP-miss mean:          0.06%     -0.10%     -0.88%
Unconditional mean:          0.26%      0.51%      1.08%

T-TEST: Post-NFP-miss vs Unconditional
--------------------------------------------------
  5-day: t=-0.498, p=0.6365  n=7
  10-day: t=-0.722, p=0.4975  n=7
  21-day: t=-1.393, p=0.2131  n=7

What this tells us

The post-miss average forward return is below the unconditional average at every horizon. At 5 days, the market returns +0.06% after a weak NFP versus +0.26% unconditionally. At 10 days, the gap widens: -0.10% post-miss versus +0.51% unconditional. At 21 days (one trading month), the divergence is most pronounced: -0.88% average post-miss versus +1.08% unconditional. That is a 196 basis point difference.

However, none of these differences are statistically significant. The t-statistics range from -0.50 (5-day) to -1.39 (21-day), and the corresponding p-values range from 0.21 to 0.64. With only 7 observations, the sample is too small to draw definitive conclusions. The standard errors are large relative to the mean differences.

The event-level data reveals substantial dispersion. The September 2021 NFP miss (194K versus 750K expected) preceded a -4.41% drawdown over 21 days. The July 2024 miss (114K) preceded a -6.72% decline. But the February 2019 miss (20K) was followed by a +3.32% rally as the market priced in a Fed pause. The same signal produced opposite outcomes depending on the broader macro context.

The most recent event, July 2026 (57K), does not yet have sufficient forward data. Its inclusion will matter for the trend: if SPY declines from here, the 21-day t-statistic moves closer to significance.

So what?

The directional pattern is clear: weak NFP reports tend to be followed by below-average returns, particularly at the 21-day horizon. The 196 basis point gap between post-miss and unconditional 21-day returns is economically meaningful even if it is not yet statistically significant.

The lack of statistical significance does not mean there is no signal. It means there are not enough observations to confirm the signal with confidence. NFP misses of this magnitude occur roughly once or twice per year. Accumulating a sample large enough for traditional significance (20+ events) would require a decade or more of data, and structural changes in the economy may invalidate older observations.

For practitioners, the implication is to treat weak NFP prints as a risk factor rather than a trading signal. The appropriate response is not to sell the index, but to consider reducing position sizes, tightening stop losses, or hedging tail risk in the 3-4 weeks following a significant payroll miss. The events where the market rallied after a weak report (2016, 2019) both occurred in contexts where the Fed was expected to ease. Events where the market fell (2021, 2024) occurred when inflation was elevated and the Fed had less room to pivot. The macro context determines whether bad news is good news or simply bad news.

Built with xfinlink — free financial data API for Python. pip install xfinlink

Built with xfinlink — free financial data API for Python. pip install xfinlink
← All articles