BLOG

Behind the numbers.

Code examples, market analysis, and data quality deep-dives.

Are Power Stocks Becoming an AI Infrastructure Trade? Momentum Screening in Python
Which AI Chip Stocks Have Margin Momentum? Profitability Trend Analysis in Python
Which AI Stocks Are Cheapest Relative to Growth? Growth-Adjusted Valuation in Python
Does AI Stock Leadership Persist? Momentum Backtest in Python
Which AI Stocks Have the Cleanest Balance Sheets? Net Cash Screening in Python
Can Risk Parity Reduce Mega-Cap Drawdowns? Portfolio Optimization in Python
Which Growth Stocks Are Self-Funding? Cash-Flow Quality Screening in Python
Which Sectors Struggle When the Dollar Rallies? Sector Rotation Analysis in Python
Do Cheap Stocks Hold Up When Bonds Sell Off? Valuation Rotation in Python
Does the Nasdaq 100 Have Better Growth Quality Than the Dow? Index Constituent Analysis in Python
Do Healthcare Cash-Flow Margins Predict Returns? Signal Evaluation in Python
Which Dividend Stocks Survive a Cash-Flow Stress Test? Dividend Screening in Python
Does Heavy Insider Selling Predict Weak Returns? Insider Flow Test in Python
Can Quality Screens Reduce Small-Cap Balance-Sheet Risk? Russell 2000 Test in Python
Which Retailers Have Positive Operating Leverage? Margin Screening in Python
Is MSTR a Leveraged Bitcoin Proxy? Rolling Beta Analysis in Python
Is Micron's Memory Cycle Recovering? Inventory and Margin Forecasting in Python
Which Sectors Work When Bonds Rally? Rate-Sensitive Rotation in Python
Do One-Month Price Extremes Reverse? Signal Evaluation in Python
Do Low-Volatility S&P 500 Stocks Reduce Drawdowns? Factor Test in Python
Is AI Capex Paying Back Fast Enough? Revenue Hurdle Forecasting in Python
Could Shorter AI Asset Lives Hit Earnings? Depreciation Stress Test in Python
How Much AI Capex Risk Can a Portfolio Remove? Constrained Optimization in Python
Is the AI Capex Trade Crowded? Rolling Volatility and Sector Rotation in Python
Did the AI Boom Come From Existing S&P 500 Members? Point-in-Time Momentum Test in Python
Is AI Revenue Circular? Customer-Vendor Capex Loop Analysis in Python
Is the AI Trade Connected to Private Credit? Rolling Correlation Network in Python
Is Apollo More Balance-Sheet Sensitive Than Peers? Leverage Screen in Python
Are AI Earnings Supported by Cash Flow? Accrual and Capex Screen in Python
Can Defensive Stocks Hedge AI Drawdowns? Basket Regime Test in Python
How Fast Does the Market Price In Fed Decisions? FOMC Event Study in Python
How Much Are Options Sellers Overpaid? The Variance Risk Premium in Python
Which Companies Have the Worst Earnings Quality? Sloan Accrual Screen with Geographic Revenue Data in Python
Does the Oil-to-Gold Ratio Signal Recessions? XLE/GLD Backtest in Python
Is AI Spending Crowding Out Free Cash Flow? Capex Sustainability Across the Mag 7 in Python
Does a Long Energy / Short Bonds Portfolio Capture Inflation Surprises? Factor Construction in Python
Can a Hidden Markov Model Detect Oil Market Regimes? HMM Analysis in Python
Do Grain Prices Predict Food Inflation? Granger Causality Test in Python
Does the Corporate Credit Spread Predict Stock Market Crashes? BAA-AAA Spread Analysis in Python
Do Oil Stocks Hedge Inflation? Rolling Beta Analysis in Python
Which Stocks Are Most Rate-Sensitive? Equity Duration via Bond Beta in Python
Which Companies Have the Highest Accrual Ratios? Earnings Quality Screening in Python
Is Alpha Persistent or Decaying? Rolling Sharpe Ratio Analysis in Python
Are Markets Trending or Mean-Reverting? Hurst Exponent Analysis in Python
Is Consumer Discretionary vs Staples a Leading Indicator? XLY/XLP Ratio Analysis in Python
Does Heavy Capex Predict Future Stock Returns? Capital Expenditure Analysis in Python
How to Estimate Cost of Equity Using CAPM in Python
Is Volatility Predictable? Testing for Volatility Clustering in Python
Which Industrials Are Overleveraged? Net Debt to EBITDA Screening in Python
GM Before and After Bankruptcy: Why Entity Resolution Matters for Financial Data
What Is Adjusted Beta? Merrill Lynch Beta Shrinkage in Python
How Good Is a Stock Pick? Information Ratio and Tracking Error in Python
Do Stock Returns Follow a Normal Distribution? Testing for Fat Tails in Python
Which Large Caps Have the Highest Free Cash Flow Yield? FCF Screening in Python
Which Sectors Won Over 5 Years? Sector Rotation Analysis in Python
How to Forecast Stock Volatility with GARCH Models in Python
Are Stock Prices Mean-Reverting? Augmented Dickey-Fuller Test in Python
How to Calculate CAPM Alpha and Beta with Regression in Python
How to Compare Sector Sharpe Ratios and Sortino Ratios in Python
DELL: Why Stitching Historical Price Data Together Is Wrong
How to Analyze Drawdown and Recovery for Bank Stocks in Python
How to Screen SaaS Stocks by Revenue Growth and Cash Flow in Python
How to Screen REITs by Dividend Yield and Valuation in Python
How Correlated Are the Magnificent 7? Intra-Group Correlation in Python
AAPL vs XOM: Do Individual Stocks Have Seasonal Patterns?
How to Rank Large-Cap Stocks by Momentum in Python
How to Build a Multi-Endpoint Financial Dashboard in Python
How to Compare Volatility Across Energy Stocks in Python
How to Screen Healthcare Stocks by Valuation in Python
How to Build a Sector Correlation Matrix for Portfolio Diversification in Python
How to Find Oversold and Overbought Stocks Using Z-Scores in Python
How to Measure Earnings Quality: Cash Flow vs Net Income in Python
How to Build a Multi-Factor Stock Screen in Python (Value + Momentum + Quality)
How to Build a Simple DCF Model for Any Stock in Python
How to Screen Tech Stocks by Revenue Growth in Python
How to Screen Stocks by Balance Sheet Health in Python
Is "Sell in May" Real? SPY Monthly Seasonality Over 10 Years
How to Compare Sector Performance YTD Using Python
How to Track S&P 500 Additions and Removals Over Time in Python
How to Screen Dividend Stocks by Yield and Quality in Python
How to Calculate Max Drawdown and Recovery Time for Any Stock in Python
How to Compare Profitability Across Mega-Cap Tech Stocks in Python
Why Ticker Symbols Are Unreliable: The Recycling Problem Every Quant Should Know
How to Calculate and Compare Stock Volatility in Python
How to Screen Blue-Chip Stocks by P/E Ratio in Python
How to Track Companies Through Ticker Changes, Bankruptcies, and Renames in Python
S&P 500 Turnover: How Much the Index Has Changed Since 2010
How to Calculate Stock Beta and Correlation in Python
← All articles

Which AI Stocks Are Cheapest Relative to Growth? Growth-Adjusted Valuation in Python

What's the question?

Artificial intelligence stocks often look expensive on simple valuation ratios. A high P/E ratio can be justified if earnings and revenue are growing quickly, but the comparison has to be explicit. Otherwise every fast-growing company can be described as expensive or cheap depending on the narrative.

This screen uses a growth-adjusted P/E ratio: P/E divided by trailing-twelve-month revenue growth measured in percentage points. A lower number means investors are paying fewer P/E turns for each point of revenue growth. This is not a full intrinsic value model. It is a compact way to compare growth and valuation in the same table.

The question is which AI-linked stocks look cheapest relative to current growth, and which require the most confidence in future expansion.

The approach

The universe is NVDA, AVGO, AMD, PLTR, MSFT, META, GOOG, AMZN, ORCL, and ADBE. Built from SEC EDGAR public filings and market data, the screen uses latest trailing-twelve-month metrics.

  1. Pull market capitalization, revenue growth, P/E ratio, price-to-free-cash-flow, and free-cash-flow margin
  2. Require positive revenue growth and a positive P/E ratio
  3. Divide P/E by revenue growth in percentage points
  4. Compute free-cash-flow yield as the inverse of price-to-free-cash-flow
  5. Rank companies by growth-adjusted P/E

Free-cash-flow yield is included because growth without cash conversion can be fragile. Negative free-cash-flow yield indicates that trailing free cash flow is negative.

Code

import xfinlink as xfl
import pandas as pd

xfl.set_api_key("YOUR_API_KEY")  # free at https://xfinlink.com/signup

tickers = ["NVDA", "AVGO", "AMD", "PLTR", "MSFT", "META", "GOOG", "AMZN", "ORCL", "ADBE"]
fields = ["market_cap", "revenue_growth", "pe_ratio", "price_to_fcf", "fcf_margin"]
df = xfl.metrics(tickers, period_type="ttm", fields=fields)
latest = df.sort_values("period_end").groupby("ticker").tail(1).set_index("ticker")

latest["growth_adjusted_pe"] = latest["pe_ratio"] / (latest["revenue_growth"] * 100)
latest["fcf_yield"] = 1 / latest["price_to_fcf"]

print(latest.sort_values("growth_adjusted_pe"))

Full script with formatting and visualisation: ai-growth-valuation-screen-python.py

Output

AI stock revenue growth versus P/E ratio with free-cash-flow yield signaled by color
=== AI Growth-Adjusted Valuation Screen ===
Universe: 10 AI platform, software, and semiconductor stocks
Latest TTM periods: 2026-02-28 to 2026-05-29
Lowest P/E per revenue-growth point: NVDA (0.45)
Highest free-cash-flow yield: ADBE (+12.4%)

Valuation ranking:
NVDA  market_cap=$5,019.3B  rev_growth=+70.7%  PE=  31.8  PE/growth_pt= 0.45  P/FCF=   42.1  FCF_yield= +2.4%  FCF_margin=47.0%
META  market_cap=$1,520.9B  rev_growth=+26.2%  PE=  21.8  PE/growth_pt= 0.83  P/FCF=   31.5  FCF_yield= +3.2%  FCF_margin=22.4%
ADBE  market_cap=$82.7B  rev_growth=+11.5%  PE=  11.9  PE/growth_pt= 1.03  P/FCF=    8.1  FCF_yield=+12.4%  FCF_margin=40.8%
MSFT  market_cap=$2,925.8B  rev_growth=+17.9%  PE=  23.4  PE/growth_pt= 1.31  P/FCF=   40.1  FCF_yield= +2.5%  FCF_margin=22.9%
GOOG  market_cap=$4,522.3B  rev_growth=+17.5%  PE=  28.5  PE/growth_pt= 1.63  P/FCF=   70.2  FCF_yield= +1.4%  FCF_margin=15.2%
AMZN  market_cap=$2,645.5B  rev_growth=+14.2%  PE=  29.4  PE/growth_pt= 2.07  P/FCF=-1070.2  FCF_yield= -0.1%  FCF_margin=-0.3%
AVGO  market_cap=$1,792.4B  rev_growth=+30.0%  PE=  62.7  PE/growth_pt= 2.09  P/FCF=   54.7  FCF_yield= +1.8%  FCF_margin=43.4%
PLTR  market_cap=$319.4B  rev_growth=+67.7%  PE= 149.7  PE/growth_pt= 2.21  P/FCF=  118.8  FCF_yield= +0.8%  FCF_margin=51.5%
ORCL  market_cap=$541.4B  rev_growth=+14.9%  PE=  33.8  PE/growth_pt= 2.27  P/FCF=  -21.9  FCF_yield= -4.6%  FCF_margin=-38.6%
AMD   market_cap=$826.9B  rev_growth=+35.0%  PE= 166.3  PE/growth_pt= 4.76  P/FCF=   96.4  FCF_yield= +1.0%  FCF_margin=22.9%

What this tells us

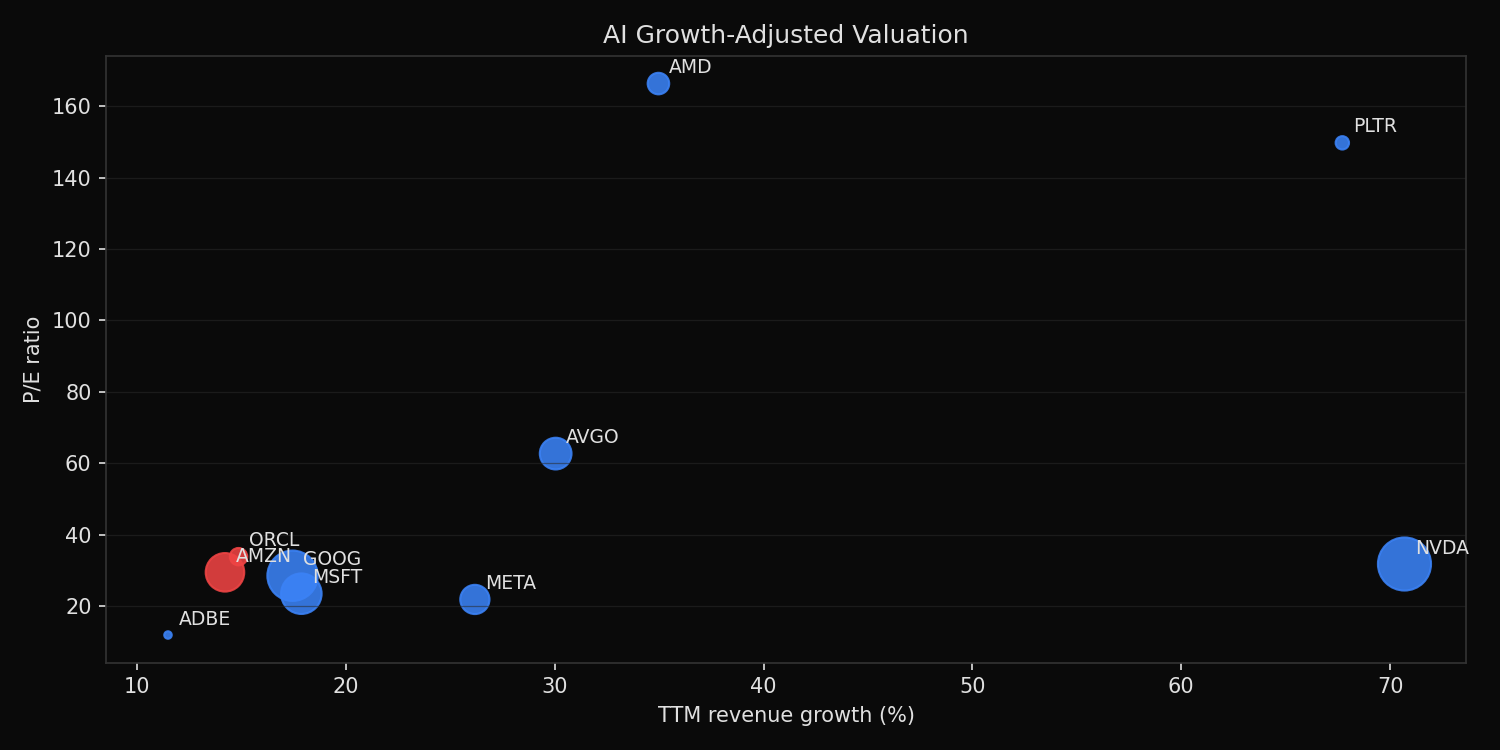
NVDA has the lowest growth-adjusted P/E in the group. Its P/E is 31.8, but revenue growth is 70.7%, producing a P/E per growth point of 0.45. META ranks second at 0.83, combining 26.2% revenue growth with a 21.8 P/E ratio.

ADBE ranks third even though its revenue growth is only 11.5%. Its valuation is low enough, and its free-cash-flow yield is high enough, to keep it competitive on this screen. It has the highest free-cash-flow yield in the group at 12.4%.

PLTR and AMD sit near the expensive end of the screen for different reasons. PLTR has very high growth, but the P/E ratio is also very high. AMD has strong revenue growth, but the P/E ratio is even higher relative to that growth. AMZN and ORCL require separate cash-flow analysis because their trailing free-cash-flow yields are negative in this window.

So what?

Growth-adjusted valuation is a triage tool. It does not replace discounted cash-flow work, but it identifies where deeper work is most justified. Low growth-adjusted P/E with positive free cash flow is a stronger starting point than low growth-adjusted P/E alone.

For AI portfolios, the useful distinction is between expensive growth and cash-generating growth. NVDA, META, MSFT, ADBE, and AVGO all have positive free-cash-flow yields. PLTR has exceptional growth but a much higher valuation burden. AMZN and ORCL need evidence that current investment spending converts back into cash flow. The screen turns that debate into a measurable hurdle.

Built with xfinlink — free financial data API for Python. pip install xfinlink

Built with xfinlink — free financial data API for Python. pip install xfinlink
← All articles