
What’s the question?
Deferred revenue is money a company has already collected for something it has not yet delivered. A customer pays for twelve months of software in January; the company banks the cash, records a liability, and releases one twelfth into revenue each month. The balance sitting in that liability account is, by construction, revenue that has been contracted and paid for but not yet reported.
That makes it an obvious candidate for a leading indicator. If deferred revenue jumps 30 percent, the sales that produced the jump have already happened, and reported revenue should follow as the balance unwinds. Software analysts have watched the line for years on exactly this reasoning, and billings models built from it are standard practice in the sector.
Whether the line earns its reputation is a separate question, and it has an obvious rival. Revenue growth itself is highly persistent: a company growing 20 percent this quarter will probably grow near 20 percent next quarter. Any candidate indicator has to beat that, not merely correlate with the outcome. A signal that agrees with the revenue line adds nothing to a forecast that already contains the revenue line. How far revenue history alone goes as a forecast, at the annual horizon, is scored out of sample in a revenue forecasting test on index companies.
The approach
The test runs on companies that genuinely bill in advance, drawn from the current S&P 500 outside Financials and Real Estate.
- Pull quarterly revenue and the current deferred revenue balance from 2019 onwards, keeping one row per company per period end.
- Keep companies whose median deferred revenue balance is worth at least half a quarter of sales, and which have at least twelve usable quarters. 50 companies clear both bars, 28 of them in Information Technology.
- Measure both variables as year-over-year growth rather than sequential change, which removes the fiscal seasonality that dominates quarterly software and travel billings.
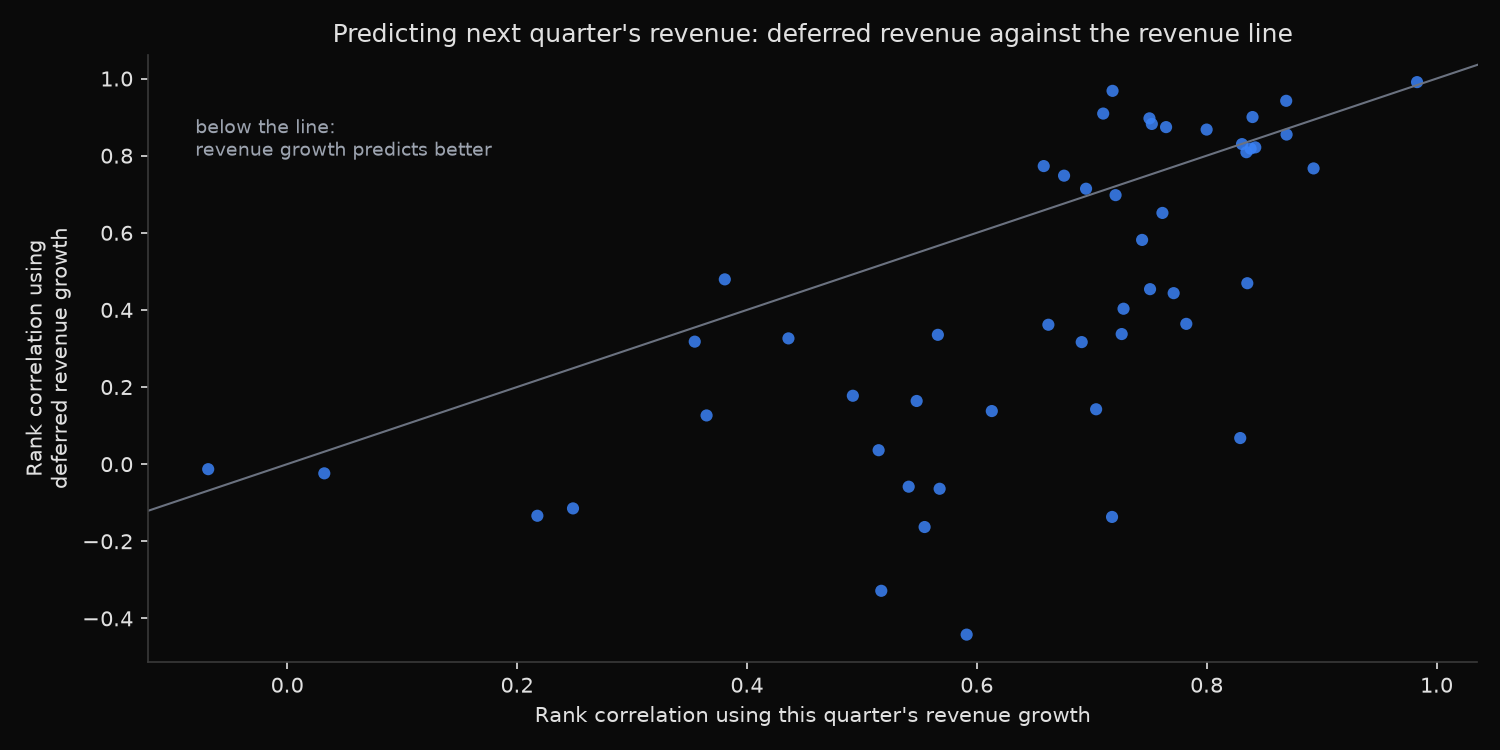
- Rank-correlate deferred revenue growth in quarter t against revenue growth in quarter t+1, then do the same for revenue growth in quarter t, and compare.
- Regress next quarter’s revenue growth on this quarter’s revenue growth, then add deferred revenue growth and ask what the second variable contributed.
Code
import pandas as pd
import statsmodels.api as sm
import xfinlink as xfl
from scipy import stats

xfl.set_api_key("YOUR_API_KEY")  # free at https://xfinlink.com/signup

ids = xfl.index("sp500")["entity_id"].dropna().astype(int).tolist()
q = pd.concat([xfl.fundamentals(entity_id=ids[i:i + 100], period_type="quarterly",
                                start="2019-01-01",
                                fields=["revenue", "deferred_revenue_current"])
               for i in range(0, len(ids), 100)], ignore_index=True)

q = q.dropna(subset=["revenue", "deferred_revenue_current"])
q = (q.sort_values(["entity_id", "period_end", "filing_date"])
       .groupby(["entity_id", "period_end"], as_index=False).last())

panel = []
for eid, g in q.groupby("entity_id"):
    g = g.sort_values("period_end")
    if (g["deferred_revenue_current"] / g["revenue"]).median() < 0.5:
        continue
    g["rev_yoy"] = g["revenue"].pct_change(4) * 100
    g["dr_yoy"] = g["deferred_revenue_current"].pct_change(4) * 100
    g["rev_next"] = g["rev_yoy"].shift(-1)
    panel.append(g.dropna(subset=["rev_yoy", "dr_yoy", "rev_next"]))

d = pd.concat(panel, ignore_index=True)
print(stats.spearmanr(d["dr_yoy"], d["rev_next"]).statistic)
print(stats.spearmanr(d["rev_yoy"], d["rev_next"]).statistic)

m1 = sm.OLS(d["rev_next"], sm.add_constant(d[["rev_yoy"]])).fit()
m2 = sm.OLS(d["rev_next"], sm.add_constant(d[["rev_yoy", "dr_yoy"]])).fit()
print(m1.rsquared, m2.rsquared, m2.tvalues["dr_yoy"])
Full script with formatting and visualisation: deferred-revenue-leading-indicator-python.py
Output
Companies: 50   quarter observations: 1192
Window: 2020-01-24 to 2026-04-04

Rank correlation with NEXT quarter's revenue growth
  deferred revenue growth  rho +0.609   p = 5.0e-122
  revenue growth           rho +0.762   p = 3.3e-227

R-squared, revenue growth alone      0.263
R-squared, adding deferred revenue   0.268
deferred revenue coefficient +0.165 (t = 2.94, p = 0.0033)

Subsamples (R-squared before and after adding deferred revenue)
  all quarters, all companies      n=1192  0.263 -> 0.268   t =  2.94
  2022 onwards                     n= 809  0.320 -> 0.320   t =  0.28
  2022 onwards, excluding travel   n= 685  0.189 -> 0.237   t =  6.52

Per company (n = 50)
  median rho, deferred revenue +0.423
  median rho, revenue growth   +0.714
  deferred revenue is the better predictor for 14 of 50 companies

Strongest deferred revenue signal:
ticker                 sector  n    dr   rev
  CRWD Information Technology 25 0.991 0.983
   MAR Consumer Discretionary 17 0.968 0.718
  GDDY Information Technology 25 0.942 0.869
  MRNA            Health Care 25 0.909 0.710
   RCL Consumer Discretionary 23 0.900 0.840
   DAL            Industrials 18 0.897 0.750
    IT Information Technology 25 0.882 0.752
   UAL            Industrials 18 0.874 0.765
What this tells us
The signal is real. Deferred revenue growth ranks +0.609 against next quarter’s revenue growth across 1,192 company-quarters, which is not a marginal result at any sample size.
It is also beaten by the simpler alternative. This quarter’s revenue growth ranks +0.762 against the same outcome, and the gap holds inside individual companies: the median company shows +0.423 from deferred revenue against +0.714 from its own revenue line, and deferred revenue is the better of the two for only 14 of 50. The scatter shows this as a cloud sitting mostly below the diagonal.
The regression explains why that matters. Revenue growth alone accounts for 26.3 percent of the variance in next quarter’s growth. Adding deferred revenue lifts that to 26.8 percent. The coefficient is statistically distinguishable from zero, and it is worth half a percentage point of explanatory power.
The subsample rows are where the interesting part sits. Restricted to 2022 onwards, the increment disappears entirely (t = 0.28). Remove nine travel and leisure companies from that same window and it returns forcefully (t = 6.52, and R-squared moves 0.189 to 0.237). Two different things are being called deferred revenue. For CrowdStrike or GoDaddy the balance is contracted subscription billings that convert on a schedule. For Royal Caribbean or Delta it is refundable customer deposits against a dated trip, which move with booking windows and cancellation behaviour and carry information about timing rather than about demand already won. Pooling the two produces a coefficient that describes neither.
So what?
Read the deferred revenue balance as a cross-check on a subscription company’s own guidance, not as a standalone forecast. Where reported revenue growth and deferred revenue growth diverge for a software business, the divergence is worth explaining: billings that outrun revenue point to contract terms lengthening or a large renewal landing early, and billings that lag revenue point at the reverse.
Do not pool the measure across business models. Grouping software billings with airline deposits destroyed a genuine relationship in this sample, and no amount of statistical care recovers it, because the two balances answer different questions.
One practical limit deserves stating. The deferred revenue balance arrives in the same filing as the revenue it supposedly leads, so it buys no advance warning over reading the income statement. Its value lies in what the current filing says about the next period, which is a different and narrower claim than the one usually made for it.
Built with xfinlink — free financial data API for Python.